The following options appear on the k-Nearest Neighbors Classification dialogs.
k-Nearest Neighbors Classification, Data Dialog
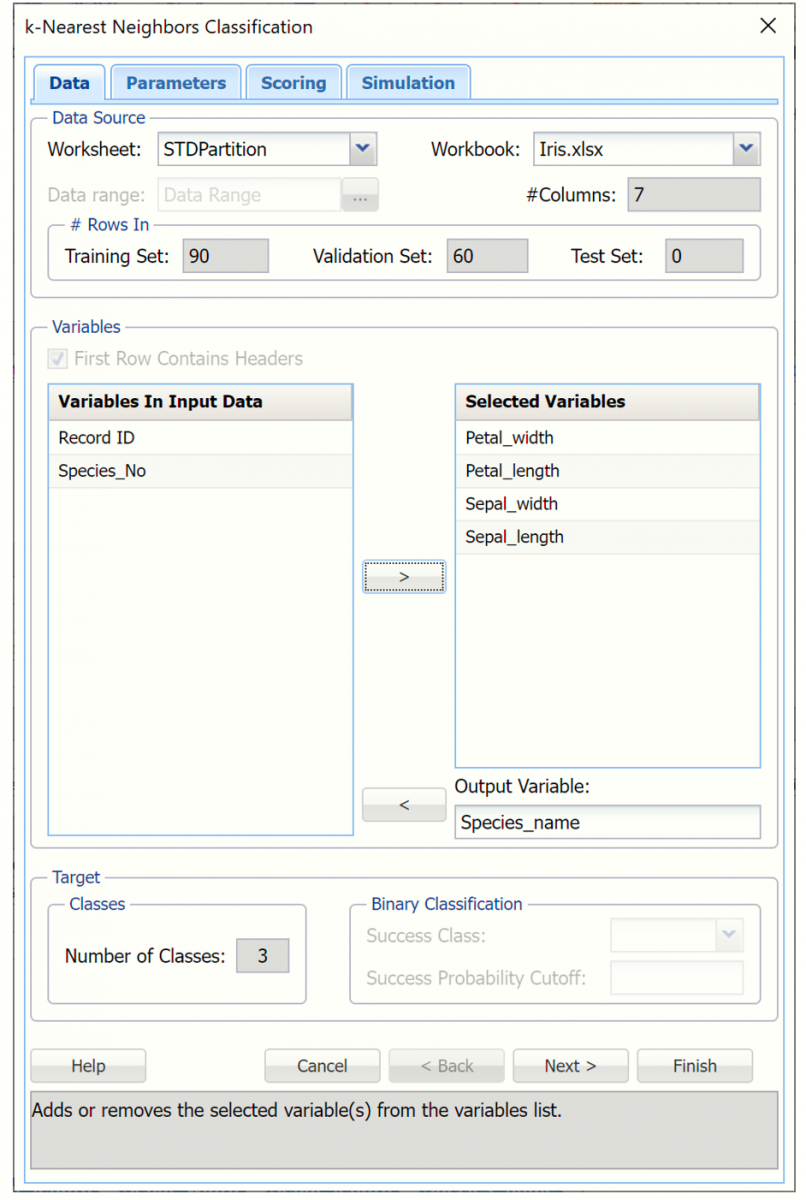 Variables In Input Data
This list contains the variables in the data set.
Selected Variables
This list contains the variables selected as input variables.
Output Variable
Enter the output variable to be classified.
# Classes
Enter the number of classes in the output variable.
Specify "Success" class (for Lift Chart)
This option is selected by default. Click the down arrow to select the value to specify a success. This option is enabled when the number of classes for the output variable is equal to 2.
Specify initial cutoff probability for success
Enter a value between 0 and 1 here to denote the cutoff probability for success. If the calculated probability for success for an observation is greater than or equal to this value, than a success (1) will be predicted for that observation. If the calculated probability for success for an observation is less than this value, then a non-success (0) will be predicted for that observation. The default value is 0.5. This option is enabled when the number of classes for the output variable is equal to 2.
k-Nearest Neighbors Classification, Parameters Dialog
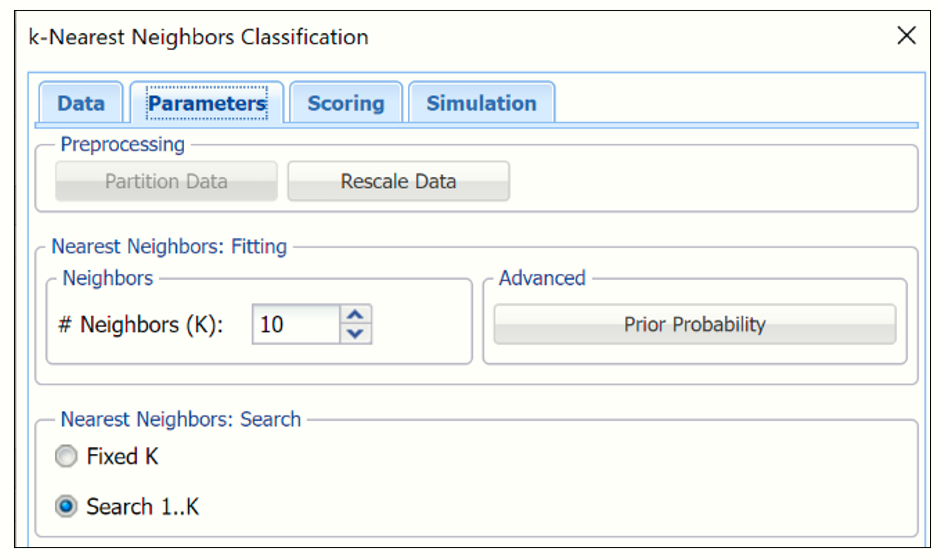
# Neighbors (k)
This is the parameter k in the k-Nearest Neighbor algorithm. If the number of observations (rows) is less than 50, the value of k should be between 1 and the total number of observations (rows). If the number of rows is greater than 50, the value of k should be between 1 and 50. Note that if k is chosen as the total number of observations in the Training Set, all the observations in the Training Set become nearest neighbors. The default value for this option is 1.
Nearest Neighbors Search
If Score on Fixed K is selected, the output is displayed for the specified value of k. If Score on Search 1...K is selected, Analytic Solver displays the output for the best k between 1 and the value entered for Number of nearest neighbors (k).
Prior Probability
According to relative occurrences in training data, Analytic Solver incorporates prior assumptions about how frequently the different classes occur. Analytic Solver assumes that the probability of encountering a particular class in the data set is the same as the frequency with which it occurs in the Training Set.
If the first option is selected, Empirical, Analytic Solver Data Science will assume that the probability of encountering a particular class in the dataset is the same as the frequency with which it occurs in the training data.
If the second option is selected, Uniform, Analytic Solver Data Science will assume that all classes occur with equal probability.
Select the third option, Manual, to manually enter the desired class and probability.
User specified prior probabilities - Select this option to manually enter the desired class and probability value.
Partitioning Options
Analytic Solver provides the ability to partition a data set from within a classification or prediction method by selecting Partitioning Options on the Step 2 of 3 dialog. If this option is selected, Analytic Solver partitions the data set (according to the partition options) immediately before running the prediction method. If partitioning has already occurred on the data set, this option is disabled. For more information on partitioning, see the Data Science Partitioning section.
Rescale Data
Use Rescaling to normalize one or more features in your data during the data preprocessing stage. Analytic Solver Data Science provides the following methods for feature scaling: Standardization, Normalization, Adjusted Normalization and Unit Norm. For more information on this new feature, see the Rescale Continuous Data section within the Transform Continuous Data chapter that occurs earlier in this guide.
k-Nearest Neighbors Classification, Scoring dialog
 New in V2023: When Frequency Chart is selected, a frequency chart will be displayed when the KNNC_TrainingScore worksheet is selected. This chart will display an interactive application similar to the Analyze Data feature, explained in detail in the Analyze Data chapter that appears earlier in this guide. This chart will include frequency distributions of the actual and predicted responses individually, or side-by-side, depending on the user’s preference, as well as basic and advanced statistics for variables, percentiles, six sigma indices.
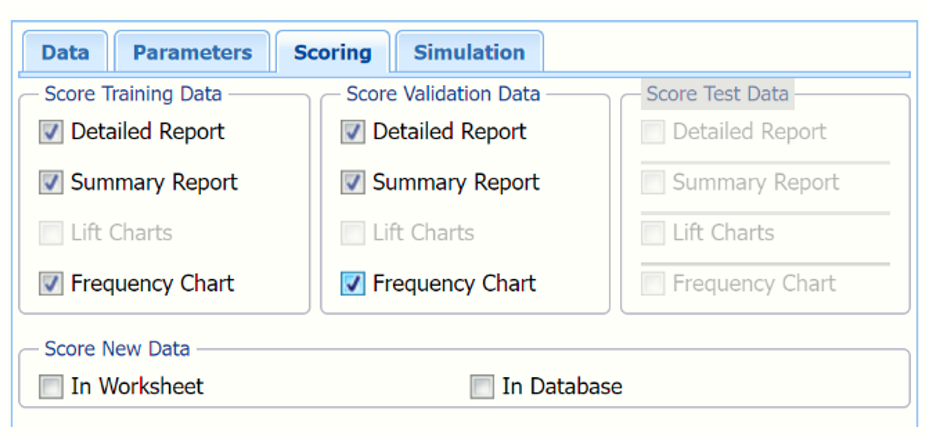
Score Training Data
Select these options to show an assessment of the performance of the algorithm in classifying the training data. The report is displayed according to your specifications - Detailed, Summary, Lift charts and Frequency. Lift charts are only available when the Output Variable contains 2 categories.
Score Validation Data
These options are enabled when a validation dataset is present. Select these options to show an assessment of the performance of the algorithm in classifying the validation data. The report is displayed according to your specifications - Detailed, Summary, Lift charts and Frequency. Lift charts are only available when the Output Variable contains 2 categories.
Score Test Data
These options are enabled when a test dataset is present. Select these options to show an assessment of the performance of the algorithm in classifying the test data. The report is displayed according to your specifications - Detailed, Summary, Lift charts and Frequency. Lift charts are only available when the Output Variable contains 2 categories.
Score New Data
For information on scoring in a worksheet or database, please see the chapters “Scoring New Data” and “Scoring Test Data” in the Analytic Solver Data Science User Guide.
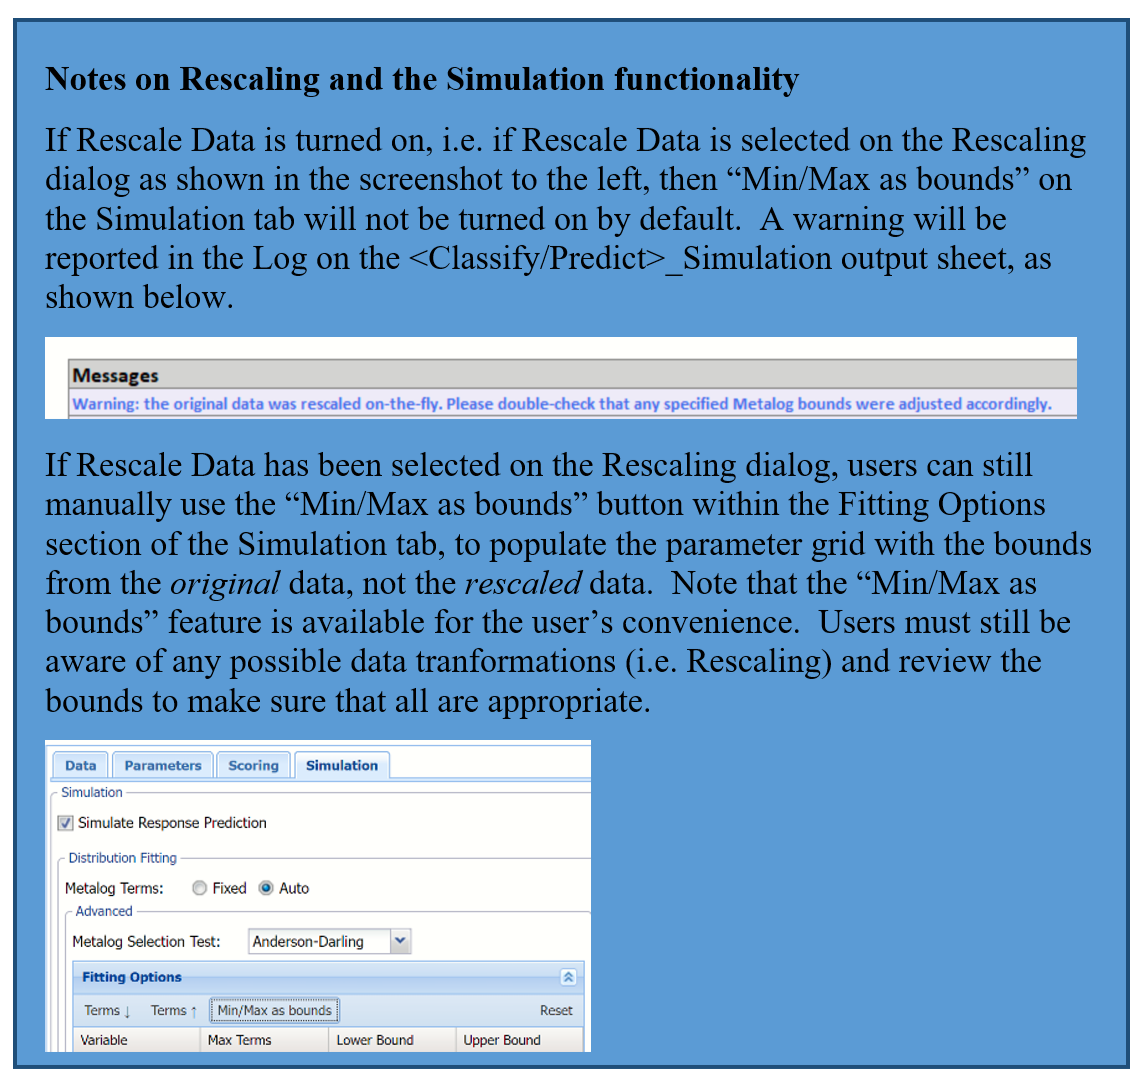
k-Nearest Neighbors Classification, Simulation Dialog
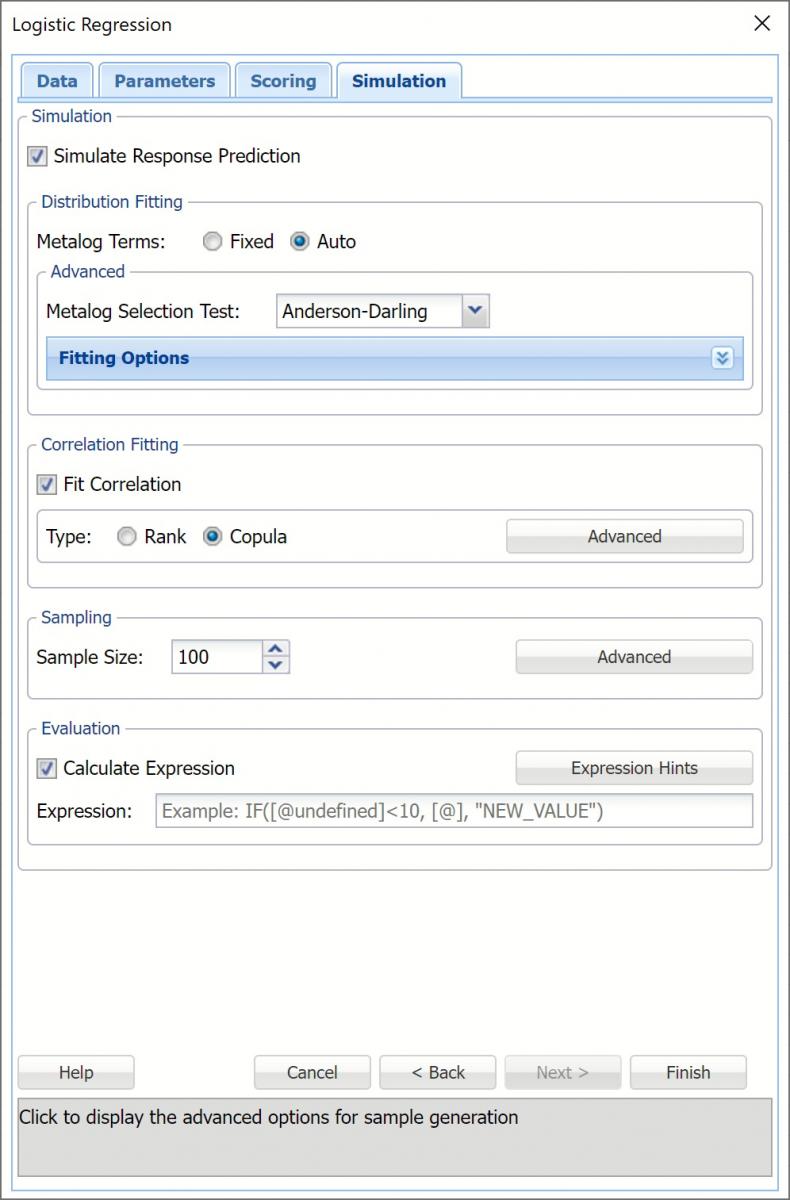 All supervised algorithms in V2023 include a new Simulation tab. This tab uses the functionality from the Generate Data feature (described earlier in this guide) to generate synthetic data based on the training partition, and uses the fitted model to produce predictions for the synthetic data. The resulting report, KNNC_Simulation, will contain the synthetic data, the predicted values and the Excel-calculated Expression column, if present. In addition, frequency charts containing the Predicted, Training, and Expression (if present) sources or a combination of any pair may be viewed, if the charts are of the same type.
Evaluation: Select Calculate Expression to amend an Expression column onto the frequency chart displayed on the KNNC_Simulation output tab. Expression can be any valid Excel formula that references a variable and the response as [@COLUMN_NAME]. Click the Expression Hints button for more information on entering an expression.