Four examples are presented in this section. The first example replaces one categorical variable with three binary variables, the second example replaces the same categorical variable with one ordinal variable and the last two examples illustrate how to use the Reduce Categories tool. The first two examples use the dataset contained within IrisFacto.xlsx, the last two use the Iris.xlsx dataset. (IrisFacto.xlsx is derived from the well-known dataset, Iris.xlsx.) Both of these datasets may be found in Help – Example Models – Forecasting/Datamining.Analytic Solver Data Science ribbon, from the Applying Your Model tab, select Help - Examples to open the IrisFacto.xlsx example database, then select Forecasting/Data Science Examples. (This data set is derived from the example data set Iris.xlsx.) This example illustrates how to create dummy variables and category scores. Note that in this data set, Species_Name is a string variable.
Example 1 Create Dummies
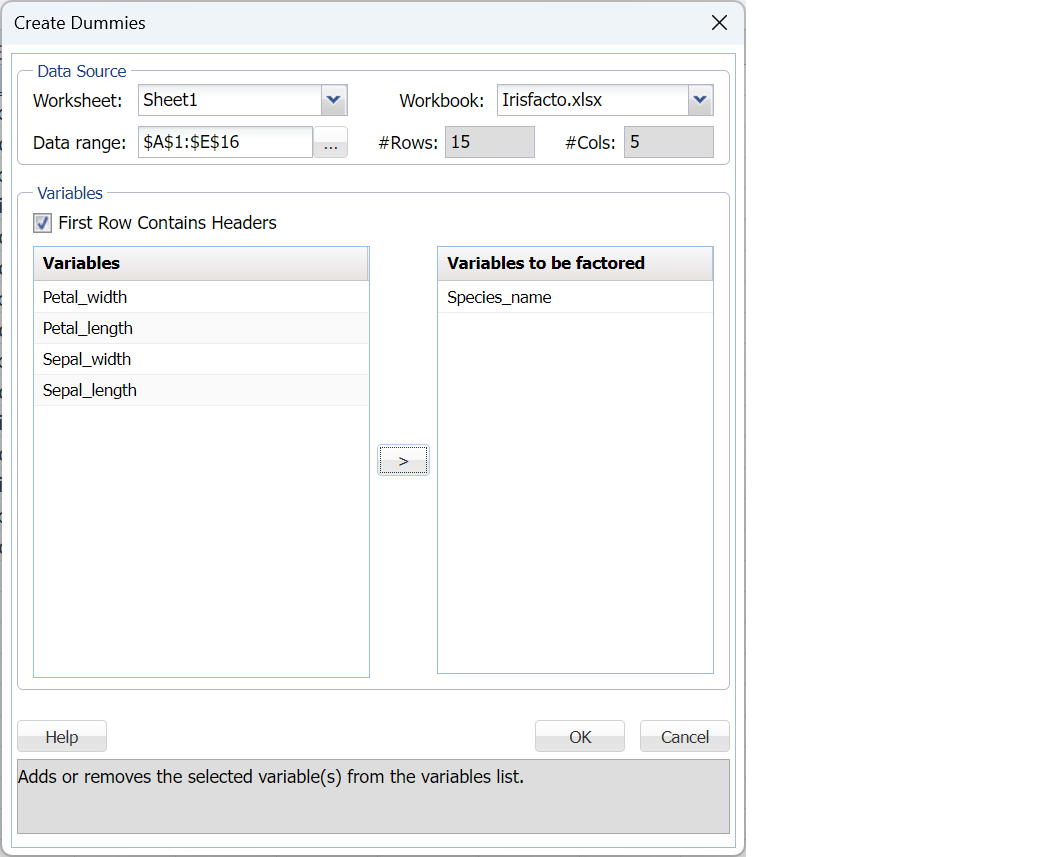
Open the Irisfacto example dataset by clicking Help – Example Models – Forecasting/Data Science Examples. Click Sheet1, select a cell within the dataset, say A2, and then Transform -- Transform Categorical Data -- Create Dummies in Desktop Analytic Solver or Transform – Categorical Data – Create Dummies in the Cloud app to bring up the Create Dummies dialog.
Select Species_name in the Variables field and then > to move the variable to the Variables to be factored field. Note that Species_Name is a string variable.
Click OK and view the output, Encoding, which is inserted on the Model tab of the Analytic Solver Task Pane under Data Science – Transformations – Create Dummies.
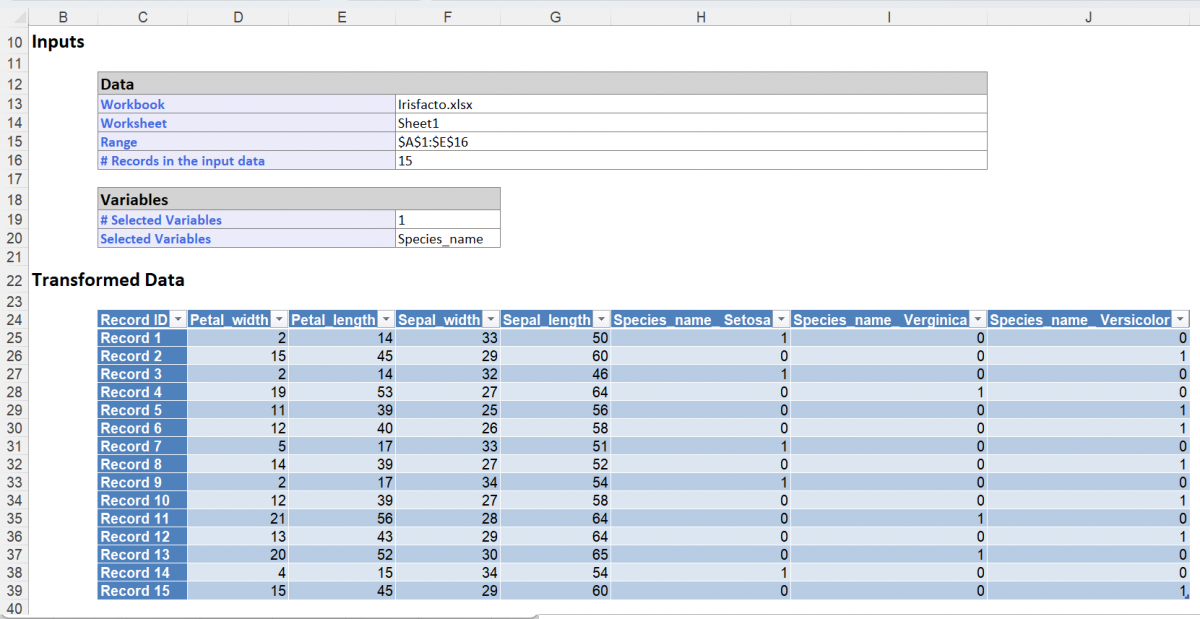
As shown in the output above, the variable, Species_name, is expressed as three binary dummy variables: Species_name_Setosa, Species_name_Verginica and Species_name_Versicolor. These new dummy variables are assigned values of either 1, to indicate that the record belongs, or 0, to indicate that the record does not belong. For example, Species_name_Setosa is assigned a value of 1 only when the value of Species_name="Setosa" is in the dataset. Otherwise, Species_name_Setosa = 0. The same is true for the two remaining dummy variables i.e. Species_name_Verginica and Species_name_Versicolor.
Analytic Solver Data Science converted the string variable into three categorical variables which resulted in a completely numeric dataset.
Example 2 Create Category Scores
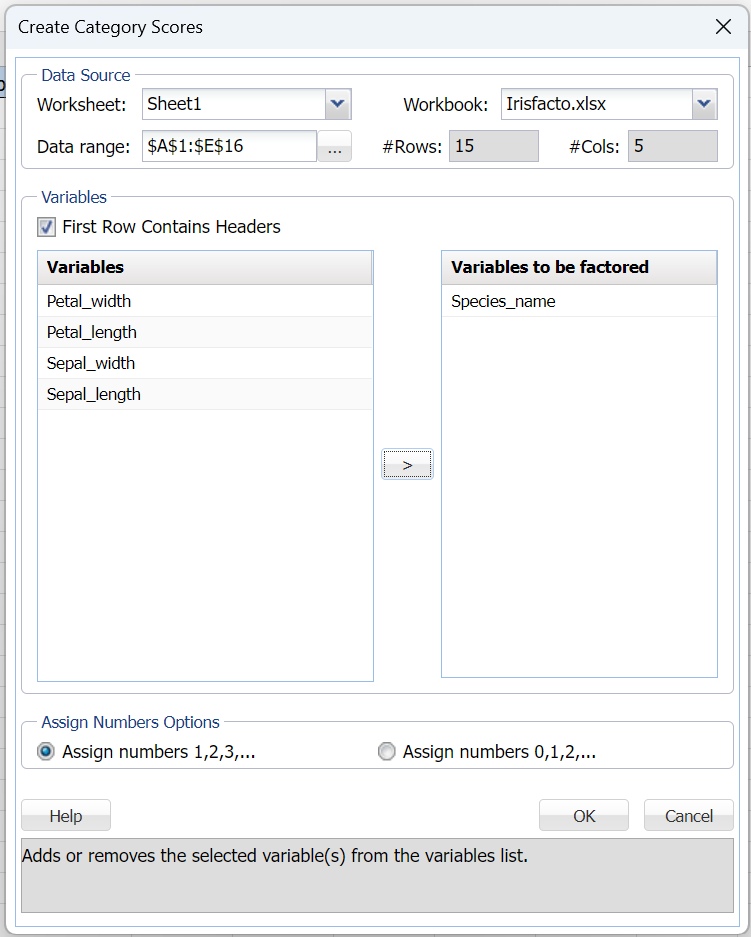
Click back to the Sheet1 and then Transform -- Transform Categorical Data -- Create Category Scores in Desktop Analytic Solver or Transform – Categorical Data – Create Category Scores in the Cloud app to bring up the Create Category Scores dialog.
Select Species_name in the Variables field and click > to move the variable to the Variables to be factored field. Keep the default option of Assign numbers 1,2,3....
Click OK. Expand Data Science – Transformations – Create Category Scores to view the results contained within Factorization.
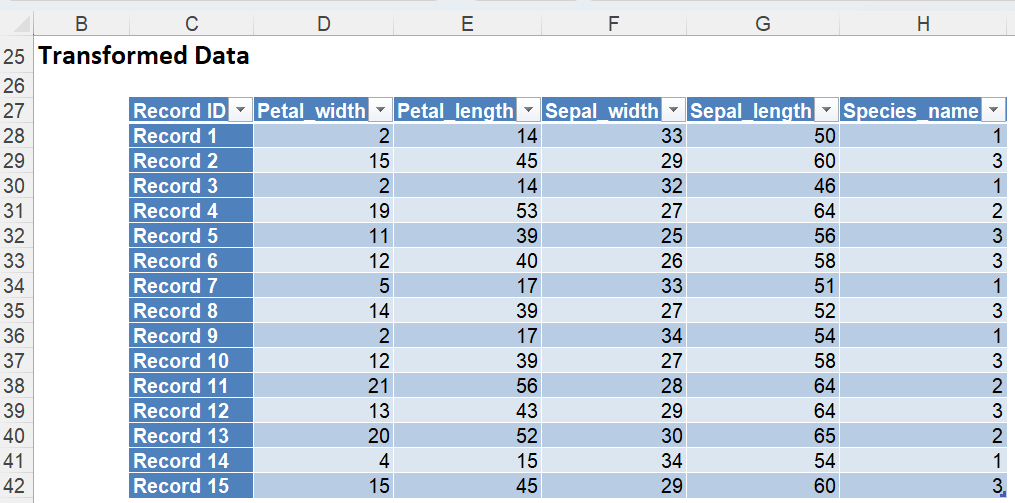
Analytic Solver Data Science has sorted the values of the Species_name variable alphabetically and then assigned values of 1, 2 or 3 to each record depending on the species type. (Starting from 1 because we selected Assign numbers 1,2,3.... To have Analytic Solver Data Science start from 0, select the option Assign numbers 0, 1, 2,… on the Create Category Scores dialog.) A variable, Factorized_Species_name is created to store these assigned numbers. Analytic Solver Data Science has converted this dataset to an entirely numeric dataset.
Example 3 Reduce Categories Manually
Open the Iris example dataset by clicking Help – Example Models – Forecasting-Data Science Examples. Select a cell within the dataset, say A1, then click Transform -- Transform Categorical Data – Reduce Categories in Desktop Analytic Solver or Transform – Categorical Data – Reduce Categories in the Cloud app to bring up the Reduce Categories dialog.
Select Petal_length as the variable…
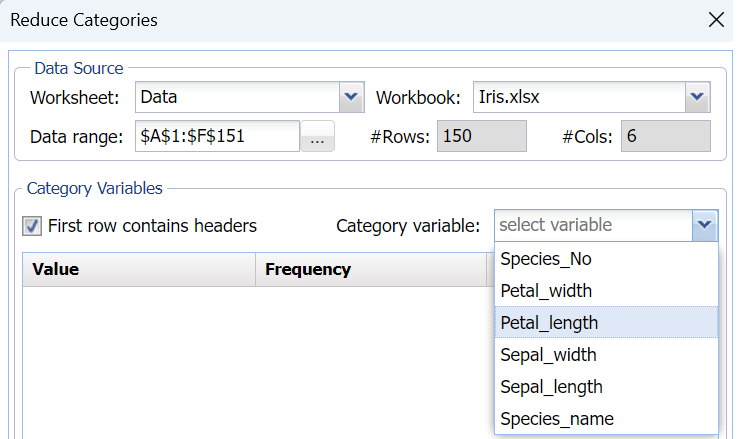
…then select the Manually radio button under Assign Category heading.
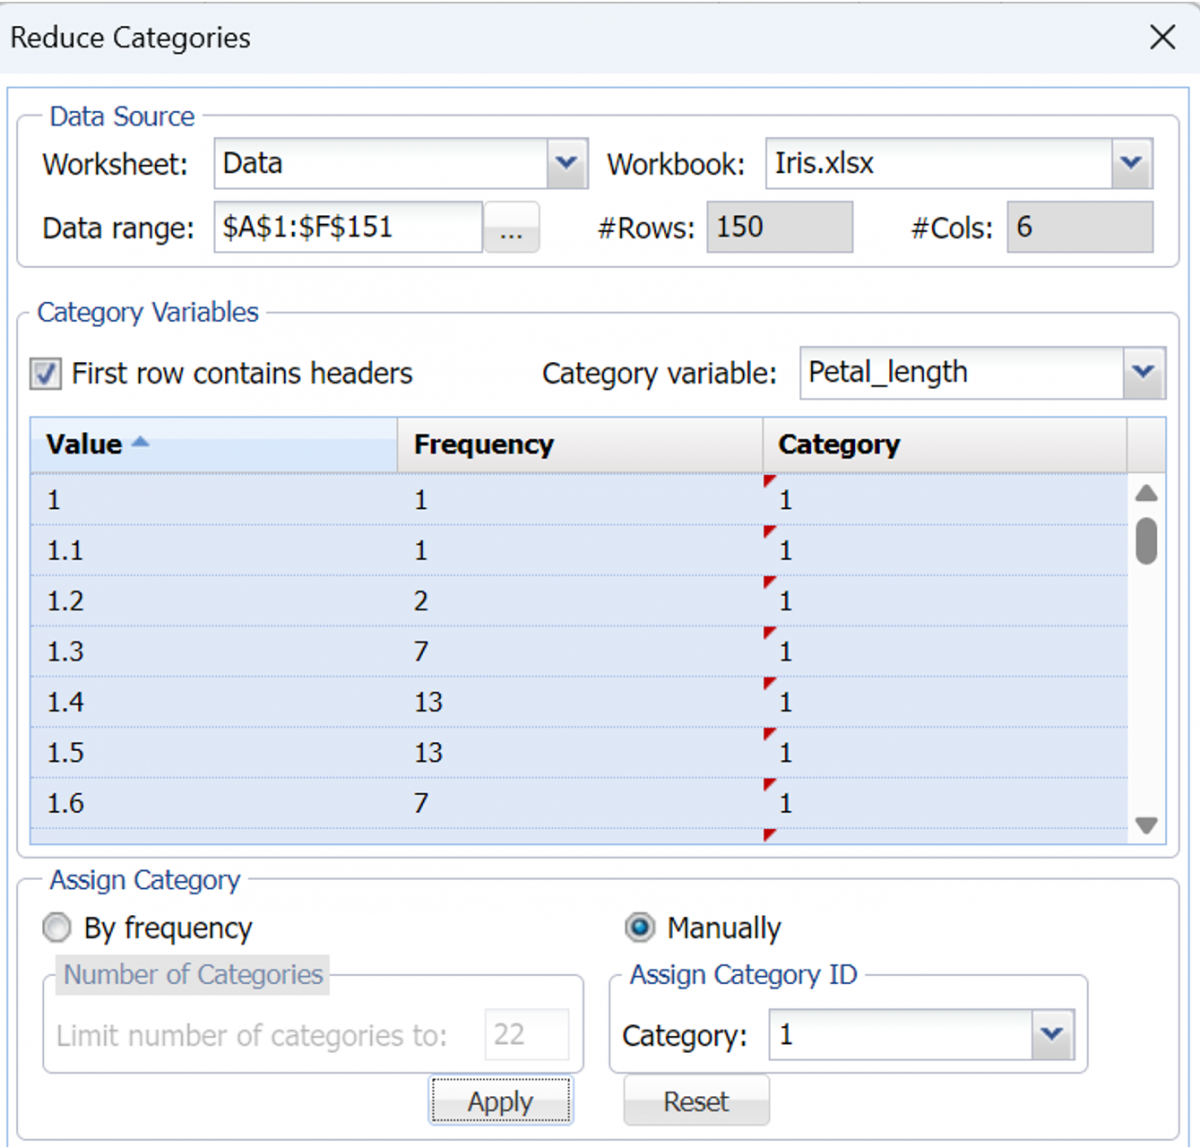
All unique values of the Petal_length variable are now listed. Select all categories with Values less than 2 (so Value = 1 to 1.9); click the down arrow next to Category and select 1, then click Apply.
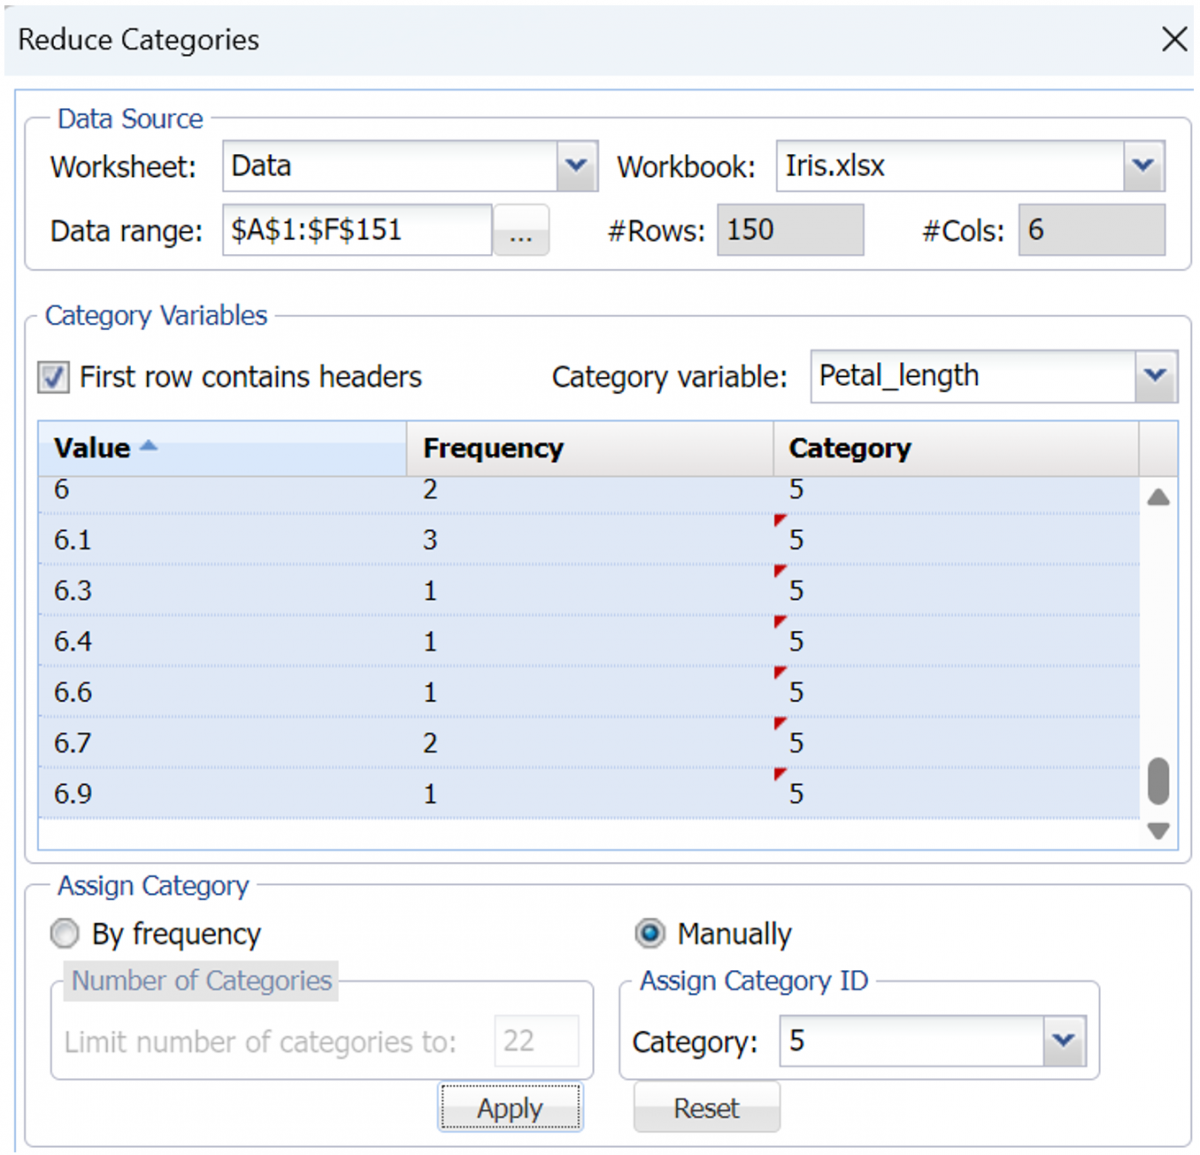
Repeat these steps for categories with values from 3 to 3.9 and apply a Category number of 2. Continue repeating these steps until values ranging from 4 thru 4.9 are assigned a category number = 3, values ranging from 5 thru 5.9 are assigned a category number = 4, and values ranging from 6 thru 6.9 are assigned a category = 5.
Notes:
- If using Analytic Solver Comprehensive or Data Science Cloud the maximum number of categories will be equal to the number of unique values for the selected variable. In this instance the petal_length variable contains 43 unique values.
- If By Frequency is selected, Analytic Solver Data Science assigns category numbers 1 through 29 to the most frequent 29 unique values; and category number 30 to all other unique values.
Click OK. The output, Category_Reduction, is inserted into the Analytic Solver task pane under Data Science – Transformations – Reduce Categories.
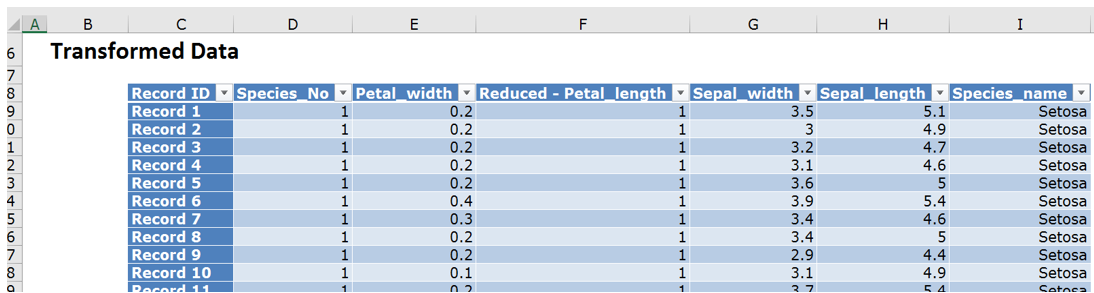
In the output, Analytic Solver Data Science has assigned new categories as shown in the column, Petal_length_red, based on the choices made in the Reduce Categories dialog.
Example 4 Reduce Categories By Frequency
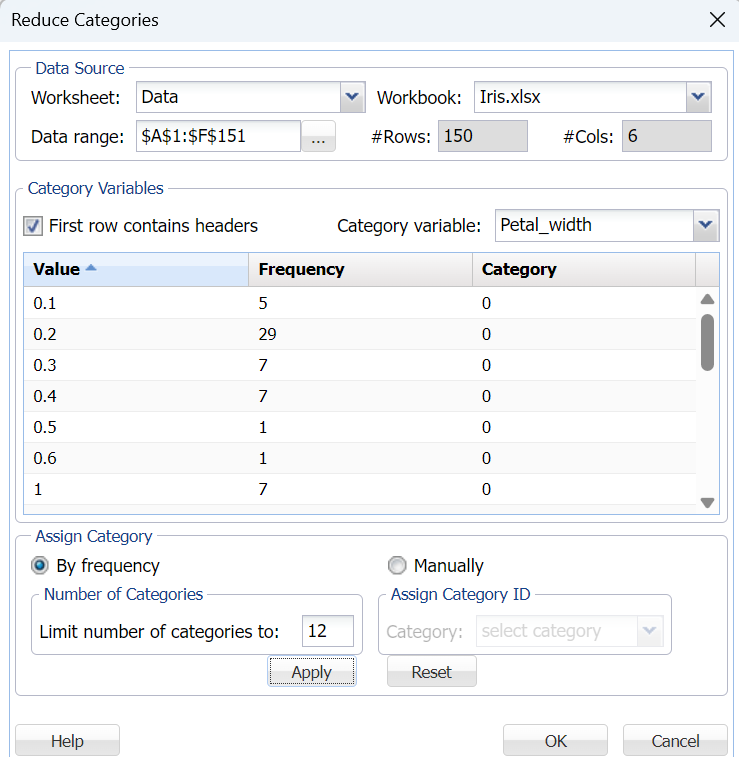
Click back to the Data worksheet and once more open the Reduce Categories dialog. This time, select Petal_width in the Category variable field, leave the default setting of By Frequency, enter 12 for Limit number of categories to, click Apply then click OK.
The output, Category_Reduction1, will be inserted into the task pane under Data Science – Transformations – Reduce Categories.
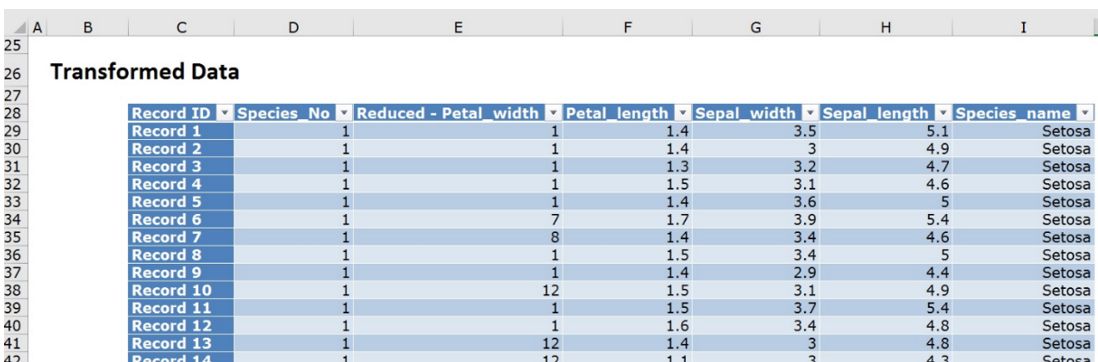
There are 22 unique values for Petal_width and Analytic Solver Data Science has classified the Petal_width variable using 12 different categories. The most frequently appearing value is 0.2 (with 29 instances) which has been assigned to category 1. The second most frequently appearing value is 1.3 (with 13 instances) which has been assigned to category 2. See the chart below for all category assignments.

Incrementally increased category numbers are assigned to each value as the number of instances decreases until the 11th category is assigned. All remaining values are then lumped into the last category, 12.