A Business Planning Example using Monte-Carlo Simulation
Imagine you are the marketing manager for a firm that is planning to introduce a new product. You need to estimate the first year net profit from this product, which will depend on:
- Sales volume in units
- Price per unit
- Unit cost
- Fixed costs
Net profit will be calculated as Net Profit = Sales Volume* (Selling Price - Unit cost) - Fixed costs. Fixed costs (for overhead, advertising, etc.) are known to be $120,000. But the other factors all involve some uncertainty. Sales volume (in units) can cover quite a range, and the selling price per unit will depend on competitor actions. Unit costs will also vary depending on vendor prices and production experience.
Uncertain Variables
To build a risk analysis model, we must first identify the uncertain variables -- also called random variables. While there's some uncertainty in almost all variables in a business model, we want to focus on variables where the range of values is significant.
Sales and Price
Based on your market research, you believe that there are equal chances that the market will be Slow, OK, or Hot.
- In the "Slow market" scenario, you expect to sell 50,000 units at an average selling price of $11.00 per unit.
- In the "OK market" scenario, you expect to sell 75,000 units, but you'll likely realize a lower average selling price of $10.00 per unit.
- In the "Hot market" scenario, you expect to sell 100,000 units, but this will bring in competitors who will drive down the average selling price to $8.00 per unit.
As a result, you expect to sell 75,000 units (i.e., (50,000+75,000+100,000)/3 = 75,000) at an average selling price of $9.67 per unit (i.e., ($11+$10+$8)/3 = $9.67).
Unit Cost
Another uncertain variable is Unit Cost. Your firm’s production manager advises you that unit costs may be anywhere from $5.50 to $7.50, with a most likely cost of $6.50. In this case, the most likely cost is also the average cost.
Uncertain Functions
Net Profit
Our next step is to identify uncertain functions -- also called functions of a random variable. Recall that Net Profit is calculated as Net Profit = Sales Volume * (Selling Price - Unit cost) - Fixed costs. However, Sales Volume, Selling Price and Unit Cost are all uncertain variables, so Net Profit is an uncertain function.
The Flawed Average Model
Before we explore how to use simulation to analyze this problem, consider the Excel model pictured below, which calculates Net Profit based on average sales volume, average selling price, and average unit cost.
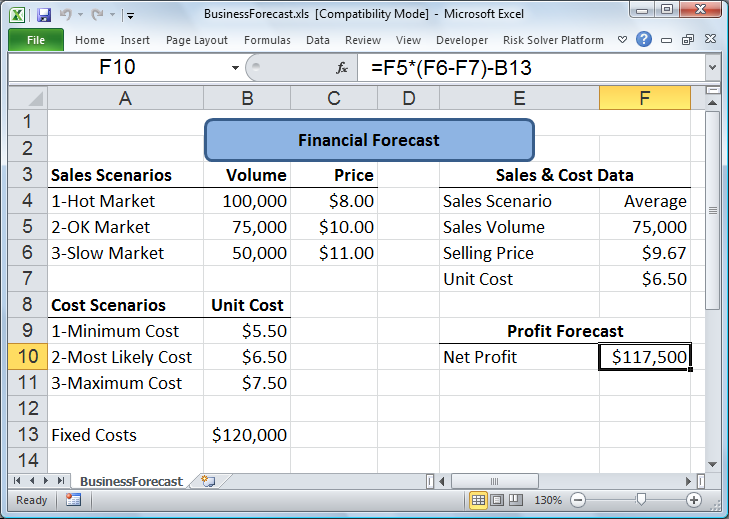
Intuition might suggest that plugging the average value of our uncertain inputs (Sales Volume, Selling Price, and Unit Cost) into our model should produce the average value of the output (Net Profit). However, as we’ll see in a moment, the Net Profit figure of $117,750 calculated by this model, based on average values for the uncertain factors, is quite misleading. The true average Net Profit is closer to $93,000! As Dr. Sam Savage warns, "Plans based on average assumptions will be wrong on average."