Powerful Data Analysis in Excel

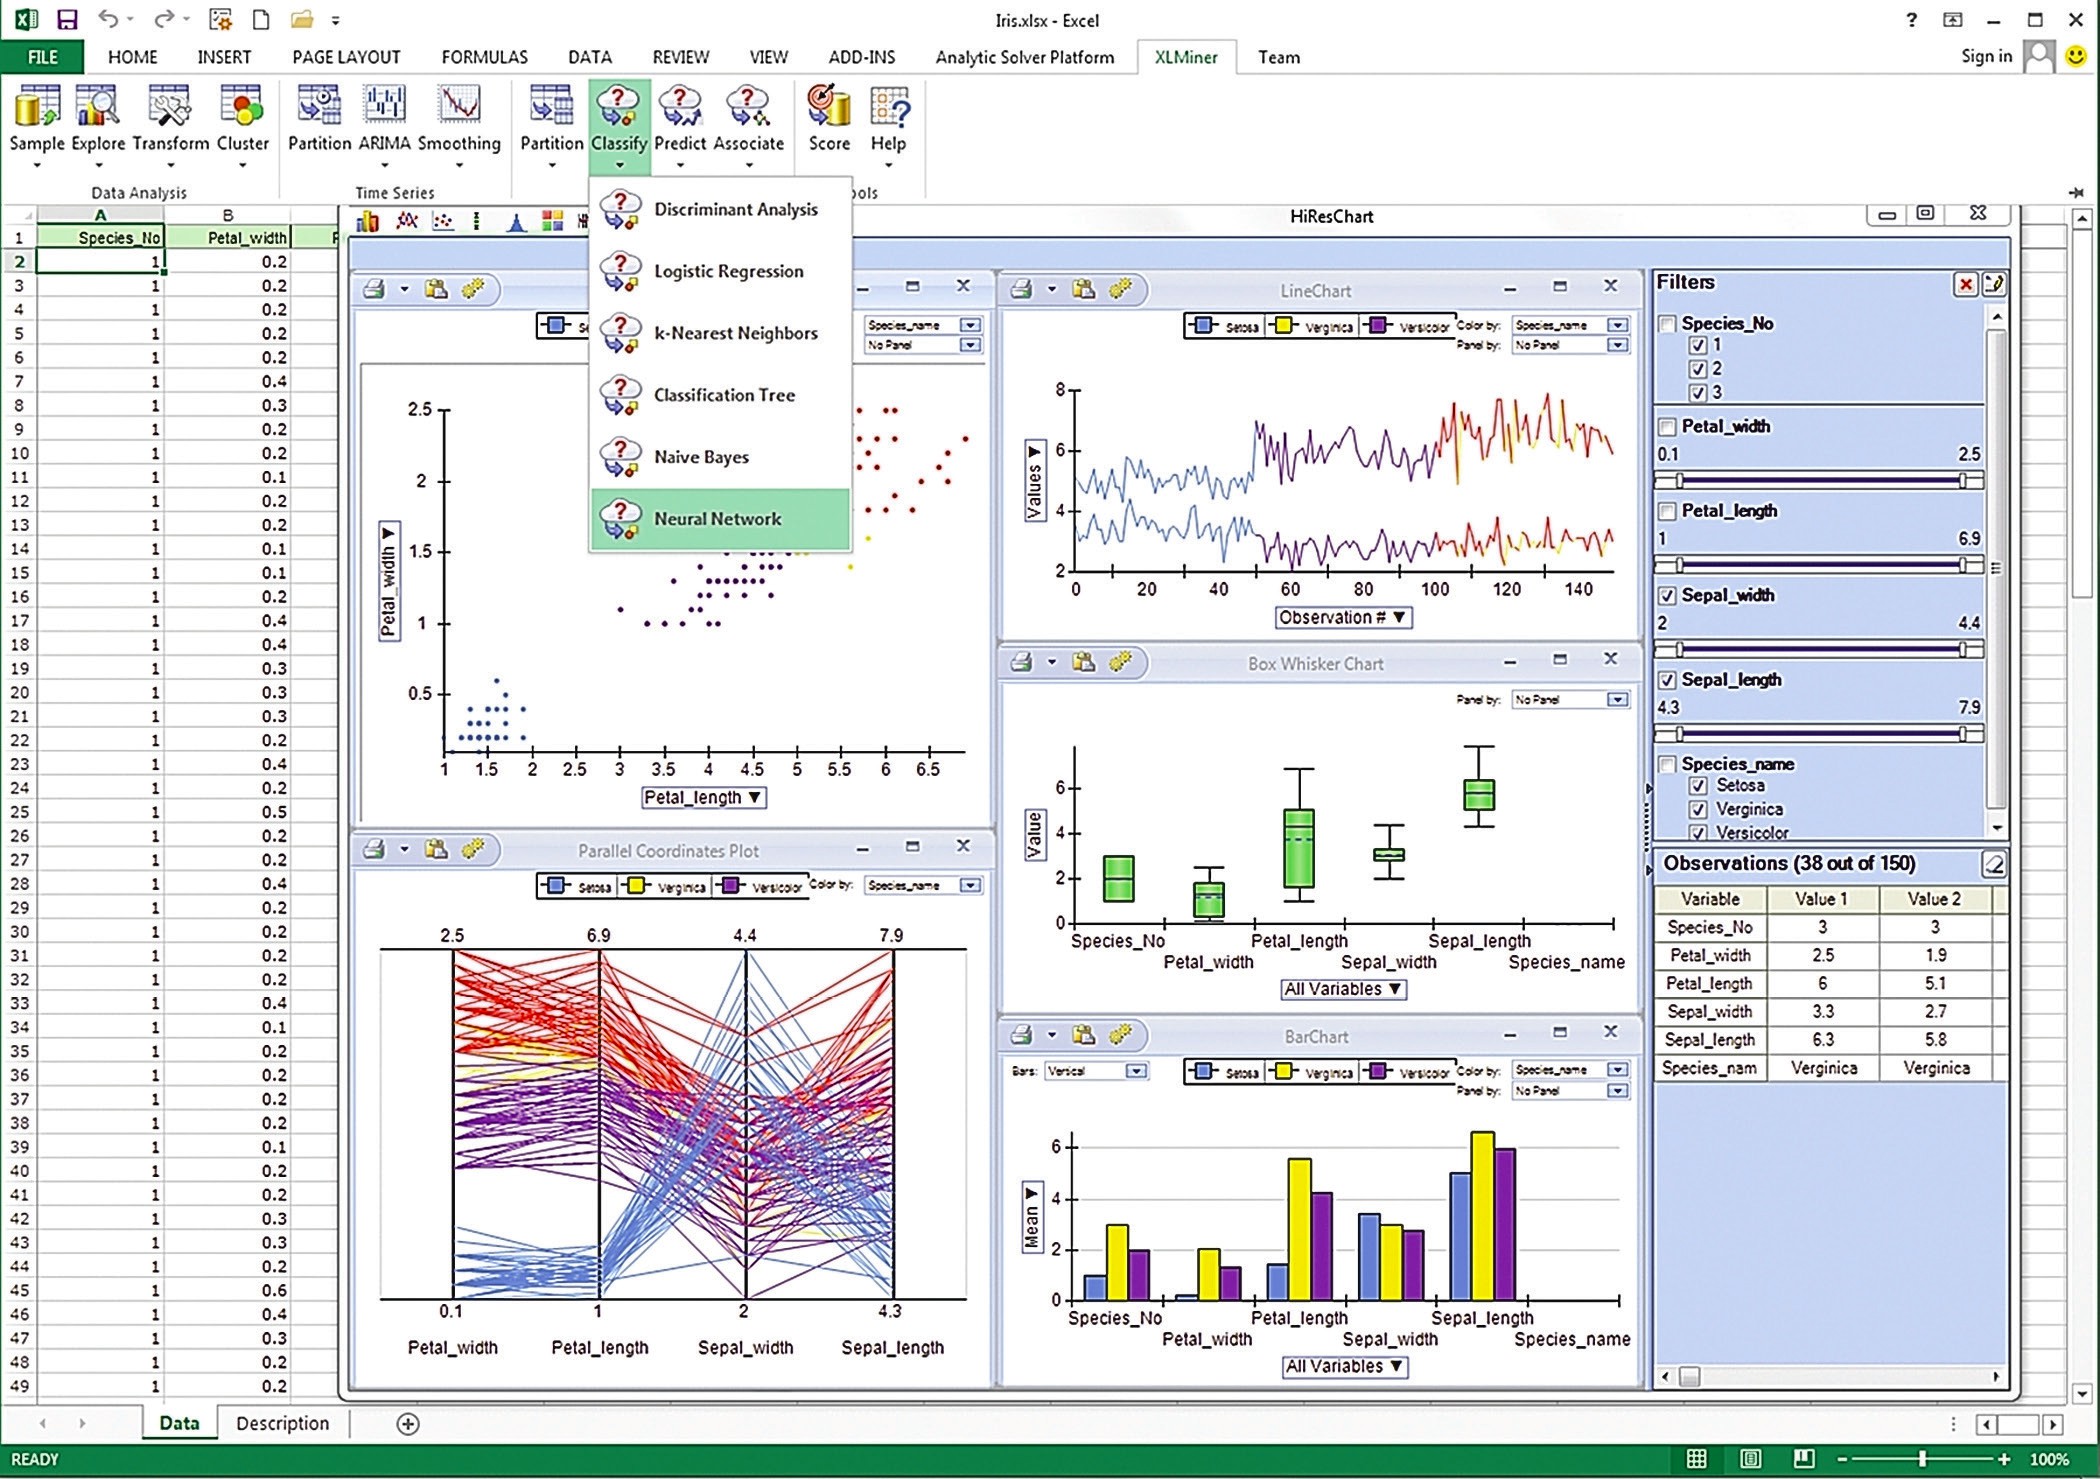
Powerful Data Mining and Predictive Analytics with XLMiner

XLMiner can help you easily visualize, transform and mine your data to build predictive models.  Do it all in Excel, drawing data from SQL databases or PowerPivot.


Turn a Mass of Data into Actionable Insights Today
 

  • Point and Click to Visualize and Explore your Data
     
  • Gain Insights with “Brushing” Across Multiple Linked Charts
     
  • Sample, Transform, and Partition your Data for Analysis
     
  • Build Classification, Prediction and Association Models
     
  • Support Live Chat means help is only seconds away


Draw Data from Outside Excel
Easily draw data from PowerPivot and SQL databases, as well as Excel workbooks. 

> Explore and Visualize Your Data
Use visualization aids like multiple linked bar and line charts, histograms and scatterplots, with one-click changes to axes, colors and panels, zooming, brushing and more.

> Find Trends in Time Series
Easily find trends and create forecasts for your time series data with exponential smoothing and ARIMA models.

> Create and Test Predictive Models
Use and compare classical methods like multiple linear regression and logistic regression, and data mining methods like regression trees, k-nearest neighbors and neural networks, and compare their predictive power.

Easy to Use Interface
Straight forward dialogs prompt you through all the steps of analysis. Our Ribbon and Task Pane interface gives you quick access to advanced features and help.

Current Customers:

  • Westinghouse
  • JD Powers
  • NASA
  • Bell Atlantic
  • Pitney Bowes
  • Monsanto
  • ExxonMobil
  • US Army
  • FDA
  • Experion
  • Fidelity Investments
  • Northrup Grumman
  • Blackstone Group
  • and more!
Full-Powered Business Analytics in Excel