The Process of Risk Analysis
The process of risk analysis includes identifying and quantifying uncertainties, estimating their impact on outcomes that we care about, building a risk analysis model that expresses these elements in quantitative form, exploring the model through simulation and sensitivity analysis, and making risk management decisions that can help us avoid, mitigate, or otherwise deal with risk.
Identify and Quantify Uncertainty
In risk analysis, our goal is to identify each important source of uncertainty, and quantify its magnitude as well as we can. For example, we may not know our competitor's exact price, but we can place bounds on it, based on known production and marketing costs. While we can't predict the exact number of people shopping at a store each day, we can examine past data for the frequency of days when (say) 10, 20, 30, ..., 100 people shopped, and use this to estimate a distribution of shoppers on future days. This process of identifying and quantifying uncertainties is a key step in risk analysis.
Compute the Impact of Uncertainty
Our next step is to accurately estimate the impact of the uncertainties on the outcomes we care about. For example, we may not be able to predict demand for our product exactly; but given a number for demand, since we know our costs and margins, we can often calculate the impact on our Net Profit. We may not know the exact number of shoppers on any future day; but given a number of shoppers, we can calculate how many store salespeople we need to service them, and estimate the sales we're likely to generate. In doing this, we build a model that allows us to compute "outputs" -- outcomes such as Net Profit -- for any given "inputs".
Complete a Risk Analysis Model
If we can complete these steps, we'll have a risk analysis model (or simply risk model). The model has inputs which are uncertain -- these may be called uncertain variables, random variables, assumptions, or simply inputs. For any given set of input values, the model calculates outputs -- outcomes such as Net Profit. Unlike other kinds of models, a risk analysis model requires us to think in ranges: Because the inputs are uncertain and may take on many different values, the outputs are also uncertain and may take on a range of values. If management asks, "Give me a number for next year's sales", a risk analyst must respond that a single number is not going to be meaningful -- it will defeat the purpose of risk analysis.
Explore the Model with Simulation
We can use our risk model in several ways -- but one effective way is to explore the possible outcomes using simulation. For a model in Excel, we can use software, such as Frontline's Risk Solver, to perform a Monte Carlo simulation on our model. Simulation performs many (thousands of) experiments or trials -- each one samples possible values for the uncertain inputs, and calculates the corresponding output values for that trial. The first run of a simulation model can often yield results that are surprising to the modelers or to management -- especially when there are several different sources of uncertainty that interact to produce an outcome. Even before an in-depth analysis of the results, simply seeing the range of outcomes -- for example, how low and how high Net Profit can be, given our model and sources of uncertainty -- can encourage a re-thinking of the risks we face, and the actions we can take.
Analyze the Model Results
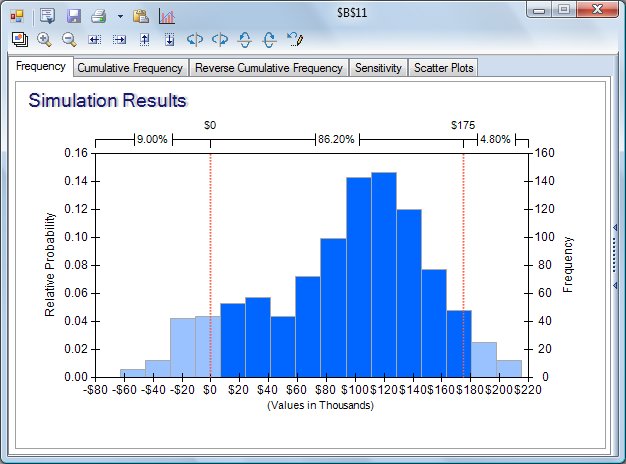
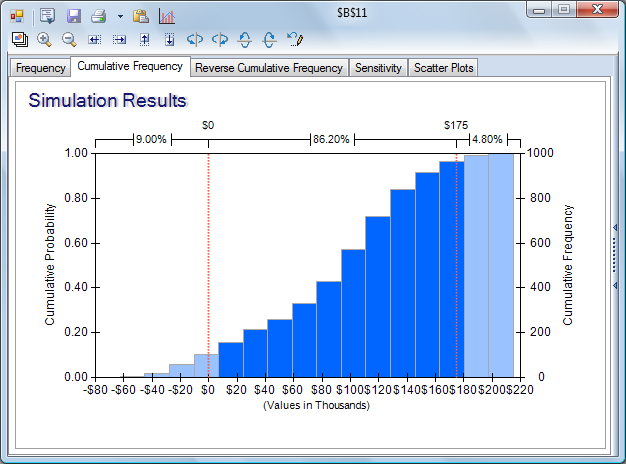
Because a simulation yields many possible values for the outcomes we care about -- from Net Profit to environmental impact -- some work is needed to analyze the results. For instance, we can summarize the range of outcomes using various kinds of statistics, such as the mean or median, the standard deviation and variance, or the 5th and 95th percentile or Value at Risk. It is also very useful to create charts to help us visualize the results -- such as frequency charts and cumulative frequency charts
Frequency Chart |
Cumulative Frequency Chart |
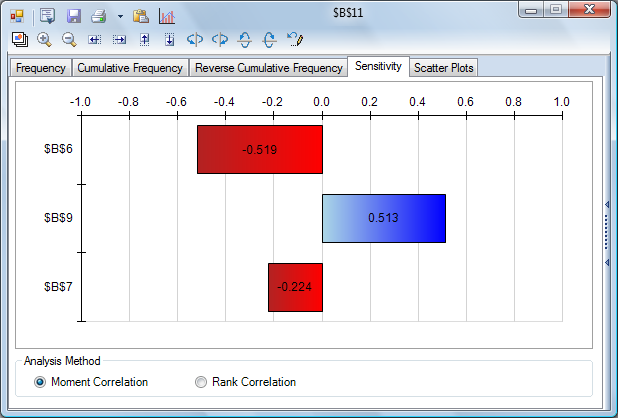
Another powerful tool for assessing model results is sensitivity analysis, which can help us identify the uncertain inputs with the biggest impact on our key outcomes. Using software, we can also run multiple simulations, with an input we choose taking a different value on each simulation, and assess the results. Analyzing the model can give us more information, but also insight about our real-world problem. For example, a tornado chart can give us a quick visual summary of the uncertainties with the greatest positive and negative impact on Net Profit.
Tornado Chart |
Make Decisions to Better Manage Risk
The payoff comes when we use our risk analysis model and simulation results to make choices or decisions, that may help us avoid or mitigate risk -- or perhaps earn greater returns that help compensate us for taking these risks. We can also compare the risk and return of different projects or investments, and we can seek to diversify our position so that no single risk can do too much harm. By doing this, we can practice risk management.
While we can't avoid uncertainty and risk altogether, there are often many steps we can take to better cope with risk. Risk analysis helps us determine the right steps to take. Our next step in this Tutorial is to take a closer look at a risk analysis model.