Easily Define Correlations Among Dissimilar Distributions
Risk Solver provides powerful ways to induce correlations among uncertain variables, even when they are generated by dissimilar probability distributions. In many modeling situations where A1 and B1 are uncertain variables, you have no way to directly compute one from the other, yet A1 may statistically depend on B1. For example, mortgage interest rates depend on bond market interest rates (since mortgages are pooled and sold as securities in the bond market), and both rates depend on inflation expectations, but it is quite difficult to specify a formula that relates these variables.
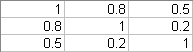
You use a correlation matrix to induce a statistical dependence, or correlation, among two or more uncertain variables. When you do this, the trial values of these variables in a Monte Carlo simulation will tend to be drawn from related percentiles of their distributions on each trial. A correlation matrix is stored in a cell range, with an equal number of columns and rows. To correlate N variables together, you need a matrix of N columns and N rows. Here's an example of a 3x3 correlation matrix.
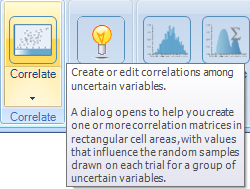
You can type in values for a correlation matrix directly on the Excel worksheet, and then reference this matrix in the PsiCorrMatrix() property function, passed as an argument to PSI Distribution functions for each of the correlated variables. But it's easier to click the Ribbon Correlate button and let the Correlation Dialog create the matrix for you.
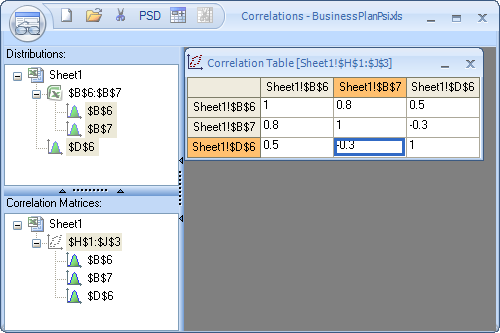
You simply select uncertain variables from an outlined list in the dialog, and click the New icon in the title toolbar. You'll be prompted to select a cell range on the worksheet for the matrix. As you fill in matrix elements, Risk Solver updates the cell range, and it also adds the proper PsiCorrMatrix() property function calls to your distribution functions. A correlation matrix must be symmetric -- the element at position i, j must equal the element at position j, i -- so whenever you enter or edit a matrix element i, j in the Correlation dialog, Risk Solver will update the j, i element to match.
A correlation matrix must be not just symmetric, but consistent. This means for example that if variable A has a high positive correlation with variable B, and B has a positive correlation with C, then variable A cannot have a high negative correlation with C. In mathematical terms, the correlation matrix must be positive semidefinite. This property depends on all the elements of the matrix. If the matrix you create by hand does not satisfy this property, Risk Solver can automatically adjust the matrix elements so that the matrix is positive semidefinite. In doing so, it can minimize changes to the matrix elements you care about, while making greater changes in the elements you don't care about.
In the example matrix above -- which is not (yet) consistent -- suppose we are happy with the rank correlation of 0.8 between variables B6 and B7; we have a tentative value of 0.5 for the correlation between B6 and D6; and we have no special information about the relationship between D6 and B7. We can indicate this by clicking the red button 'Less Likely to Change,' then clicking either 0.8 element, and clicking the yellow button 'More Likely to Change,' then clicking either 0.5 element.
When we do this, the matrix elements are colored as shown below.
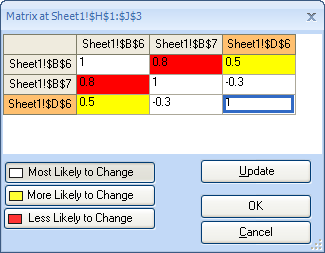
We then click the Update button to adjust the matrix. Risk Solver finds a positive semidefinite matrix where the correlation between variables B6 and B7 is adjusted by just 5%, the correlation between B6 and D6 is adjusted by 8%, and the correlation between D6 and B7 receives the largest adjustment, about 24%:
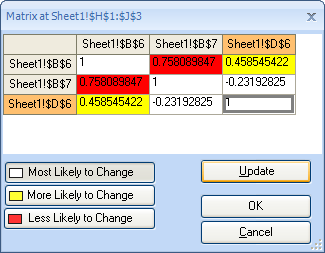
You can save the results by clicking the OK button, or discard the adjustments and return to the matrix you originally entered in the Correlation dialog by clicking the Cancel button.