Define Uncertain Inputs With Probability Distributions
Risk Solver's Uncertain Variable dialog provides everything you need to define "inputs" -- random variables -- and work with probability distributions. You can select distribution types and enter parameter values; view the distribution's PDF or CDF and watch its shape change as you adjust parameters; view analytic moments and percentile values based on your chosen parameters; customize, and print or copy and paste charts of the distribution; and automatically fit a distribution type and parameters to sample data that you supply.
The Uncertain Variable dialog appears when you open one of the Distribution drop-down galleries (Continuous, Discrete, Custom, and Certified) and click the button for a specific distribution. It also appears when you double-click a worksheet cell containing an uncertain variable, or the cell address of such a variable in the Model Outline window.
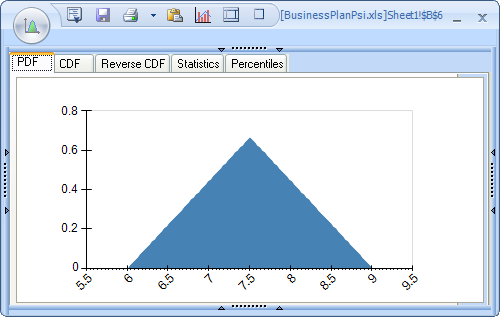
In its simplest form, the Uncertain Variable dialog shows a chart of the distribution's probability density (PDF) or cumulative density (CDF) function. Below is an example of a Triangular distribution. Notice that all four borders of the dialog may be clicked to display more information. You can also use the two rightmost icons in the title toolbar to fully expand and contract the dialog. The Statistics and Percentiles tabs display analytic moments and percentile values, computed from the distribution parameters.
In its most complete form, the Uncertain Variable dialog displays a wealth of options, allowing you to choose a new distribution type, enter or select cells for distribution-specific parameters (such as min, most likely, and max below), enter or select "control" parameters that shift, truncate or lock the distribution, or supply a random seed specific to this variable.
You can also choose and apply chart formatting options, causing the chart to be instantly updated, and print or copy and paste any of the charts in the dialog.
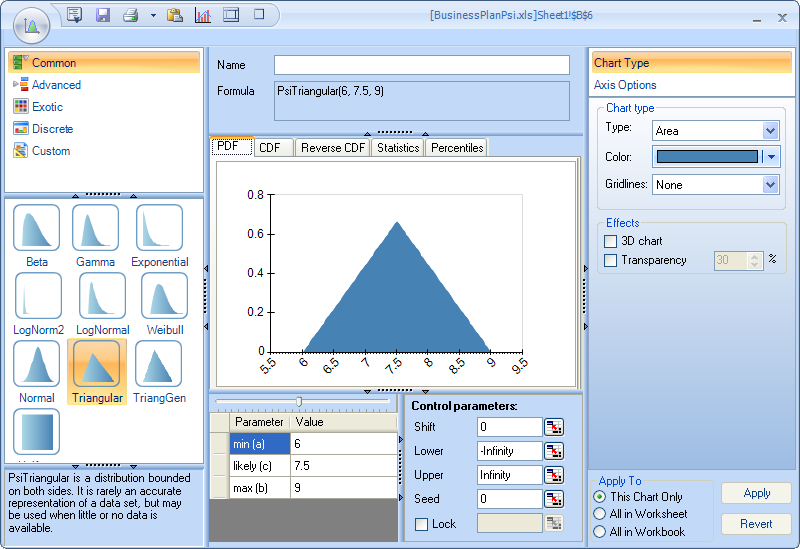
The top of the Uncertain Variable dialog contains a formula, such as =PsiTriangular(6, 7.5, 9) above, that will be written to the active cell on the worksheet when you click the Save icon in the title toolbar, or when you close the dialog and answer Yes to a prompt.
Unlike some other risk analysis tools for Excel, Risk Solver's uncertain variables are always visible and editable on the worksheet. There is no "hidden information" about uncertain variables or functions that you can only access through the graphical interface. This make it much easier to develop a custom application and deploy it to end users who don't have the full Risk Solver GUI product.