Easily Compute Statistics and Risk Measures for Any Output
Risk Solver provides a full range of statistics, risk measures, and other summaries of uncertain functions. You can use any of these in cell formulas, by typing functions such as PsiMean(B9) or PsiPercentile(B9, 0.95). You don't have to look up the function names or parameters -- you can use the Excel Function Wizard, or just drag and drop them from the Ribbon Statistics, Risk Measures and Ranges dropdown galleries.
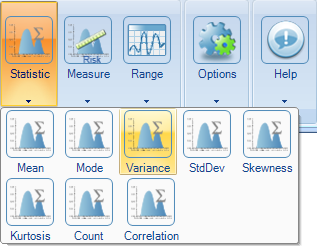
The Statistics gallery provides easy ways to compute the Mean, Mode, Variance, Standard Deviation, Skewness, and Kurtosis of an uncertain function, or the Pearson product-moment correlation coefficient between two uncertain variables or functions. You can also obtain a Count of all Monte Carlo trials, normal trials, or error trials.
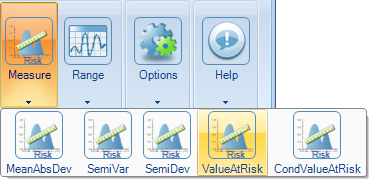
The Risk Measure gallery provides easy ways to compute the Mean Absolute Deviation, SemiVariance, SemiDeviation, Value at Risk, or Conditional Value at Risk. The PsiSemiVar() and PsiSemiDev() functions generalize to accept exponents other than 2, allowing you to compute the Lower Partial Moment.
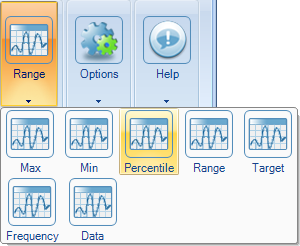
The Range gallery provides easy ways to compute the Maximum, Minimum, or Range of an uncertain function, or the estimated probability that it will be less than or equal to a Target that you specify. You can obtain any Percentile value from 1% to 99%, and you can obtain a Frequency distribution of outcomes, in a range of cells covering the number of bins and bin sizes that you want. You can even put the raw Monte Carlo trial data for an uncertain function on the worksheet.
As with uncertain variables and uncertain functions, Risk Solver's statistics and risk measures are always visible and editable on the worksheet. And unlike other risk analysis products for Excel, statistics in Risk Solver are live -- they update instantly based on new simulation results, each time you change a number in your spreadsheet!