Analysis of Simulation Results
In simulation, we create a mathematical model of a system or process, usually on a computer, and we explore the behavior of the model by running a simulation. A simulation consists of many -- often thousands of -- trials. Each trial is an experiment where we supply numerical values for input variables, evaluate the model to compute numerical values for outcomes of interest, and collect these values for later analysis.
Charts and Graphs
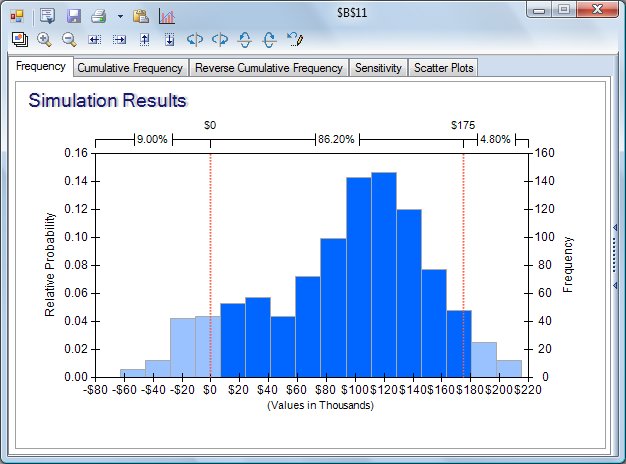
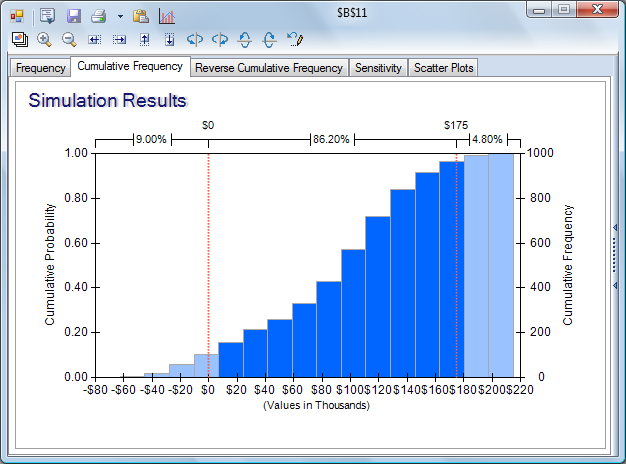
A simulation yields many possible values for the outcomes we care about -- from Net Profit to environmental impact. The role of simulation analysis is to summarize and analyze the results, in a way that will yield maximum insight and help with decision-making. It is very useful to create charts to help us visualize the results -- such as frequency charts and cumulative frequency charts.
|
Frequency Chart |
Cumulative Frequency Chart |
Statistical Measures
Statistics often play a key role in summarizing the range of values for each outcome of interest in a simulation analysis. When the outcome is important to us, statistics come to life!
A good simulation software package, such as Frontline's Analytic Solver, provides a variety of statistics:
- Measures of central tendency such as the mean, median and mode
- Measures of variation such as the variance or standard deviation, skewness, and kurtosis
- Risk measures such as mean absolute deviation, semivariance or lower partial moment, and semideviation
- Quantile measures such as percentiles, cumulative targets, Value at Risk, and Conditional Value at Risk
- Confidence intervals that tell us how close our computed sample mean or standard deviation is to the true value
It's important to look at quantile measures, such as percentiles and Value at Risk, in addition to measures of central tendency and variation. Quantile measures help you answer questions such as “How much money might we lose, with 5% or 10% probability?” or “What are the chances that we’ll make at least $100,000?” based on your simulation model.
A simulation uses a sample of the possible values of your uncertain variables; hence any statistic resulting from the simulation involves some degree of sampling error. Confidence intervals help you assess this error, and estimate the range or interval in which you can be confident that the true statistic lies, at a confidence level that you specify.
Sensitivity Analysis
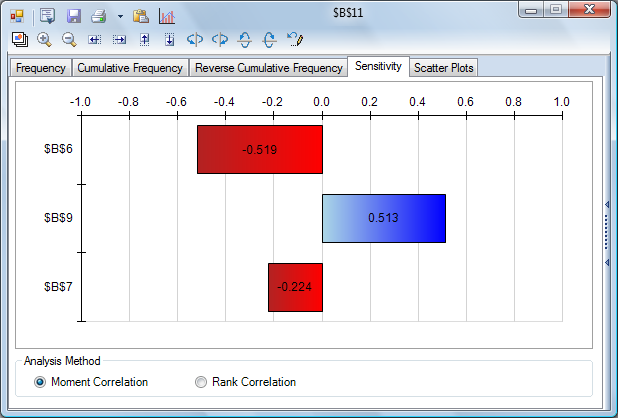
A powerful tool for assessing model results is sensitivity analysis, which can help us identify the uncertain inputs with the biggest impact on our key outcomes. For example, a tornado chart can give us a quick visual summary of the uncertainties with the greatest positive and negative impact on Net Profit. Using software, we can also run multiple simulations, with an input we choose taking a different value on each simulation, and assess the results. Analyzing the model can give us more information, but also insight about our real-world problem.
|
Tornado Chart |
Parameterized Simulation
Another powerful method for simulation analysis is running a parameterized simulation. In this method, we run a series of simulations, where we vary the value of one or more variable(s) that we can control -- such as our offering price, our inventory restocking level, or our allocation of investment funds to different asset classes. Each simulation run tests a wide range of values for the uncertain variables in our model, collects results for our outcomes of interest, and produces summary statistics, charts and graphs. We can then compare the different simulations to each other, to better understand how varying the decision variable(s) affects our outcomes, in the presence of uncertainty.
< Back to: Choosing Probability Distributions
< Back to: Simulation Tutorial Start Next: Simulation Optimization >