By Tianyang Wang, Francisco Zagmutt, and Huybert Groenendaal
“Uncertainty is the only certainty there is, and knowing how to live with insecurity is the only security.” – John Allen Paulos
Understanding and managing risks are crucial parts of every business. Conceptually, running a business is like navigating a ship in the ocean: There will always be a variety of risks driven by wind, wave, tide, and storm—or even by unpredictable icebergs that can sink the unsinkable Titanic. As risk is such an integrated part of the journey, there is an inevitable need to analyze, understand, and manage it. Unfortunately, most organizations (and people) spend a lot more time on planning for what they believe is the “most likely future,” than on understanding the uncertainties around their decisions, forecasts, and budgets, and on preparing to confidently navigate or mitigate future risks.

Risk analysis by using Monte Carlo simulation (hereafter also referred to as simulation modeling) is a very beneficial tool to help organizations better understand future risks and scenarios, and make informed decisions. Based on the Monte Carlo tutorial this tutorial will continue the discussion on the importance of risk management and the perils of ignoring it. We will first make the case for how risk analysis and Monte Carlo simulations can help with making better business (and personal) decisions using a simple model; we will explain how simulation modeling works with a more complex/complete case-study; and finally, we will discuss a range of different applications, as well as several factors that are critical to benefitting from the use of simulation modeling to improve decision making.
Analyzing Risk: Start the Dialogue with A Simple Model
The basic idea of Monte Carlo simulation is to (quantitatively) play out many what-if scenarios and to statistically examine how a decision or situation will perform under all possible future (simulated) scenarios. While it is typically too costly or sometimes even impossible to perform an experiment in the “real world,” we can easily simulate it in a Monte Carlo model. There are many professional software applications (such as spreadsheet-based Analytic Solver Simulation, an Excel add-in) that are intended to help develop and use a Monte Carlo model easier and more user friendly.
To demonstrate the mechanics of preparing and using a Monte Carlo simulation model, we start with a simple example. Suppose a global pharmaceutical company is considering its 5-year planning budget, and its base budget of operating profits (OP) is displayed in Figure 1.
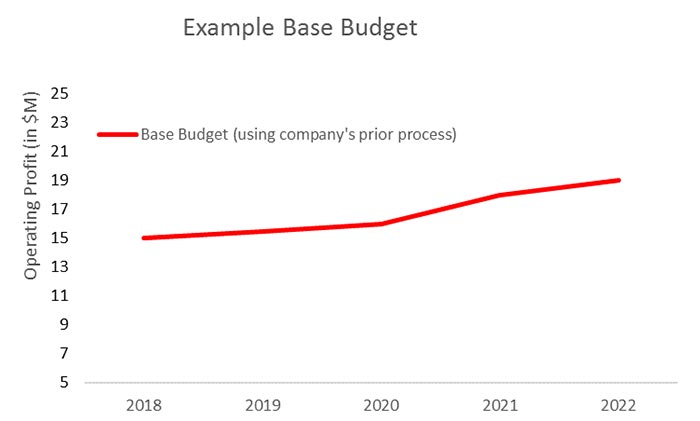
Figure 1. Base Budget of Operating Profits
During its budgeting process, the company carefully sets its ‘base budget’ at a level that management thought was reasonable and realistic. However, a critical challenge of setting a base budget is that the company’s budget contains many risks: uncertain commercial success of products, key drug R&D and approval risks, regulatory and legal uncertainties, etc. And even though management knows about all of these individual risks, it is very difficult to determine the aggregate impacts of so many different risks on the budget. Fortunately, developing a well-thought-out risk-based simulation model can help.
To build the simulation model, the scope of relevant risks must first be understood. While this step is not covered in this article, its importance should not be underestimated. In fact, a lot of value can often already be obtained from brainstorming and discussing the potential risks with diverse stakeholders (e.g., R&D, marketing, legal, regulator, and/or finance departments). In the second step, a simulation model can be developed to incorporate the identified risks. While some of the identified inputs may be available from existing data (e.g., past sales and costs), others may require estimates of future revenues and risks that have not yet occurred. If available and relevant, historical data can be used to determine the appropriate distributions for uncertain variables. When historical data are not available, or there is a reason to believe that the future behavior of a variable will be significantly different from the past, then expert opinion from different business units can be used to estimate the probabilities and potential impacts of future risks. For example, we can identify probability distribution of the growth in annual sales by fitting the historical annual sales-growth data to a Normal distribution (Figure 2). In addition, Figure 3 shows the potential future peak sales (in thousands of units) of a new product estimated as a PERT distribution, which is a probability distribution that is often used to model expert opinion. The example distribution shows that the company forecasts sales to be between 10,000 and 25,000, with the most likely estimated number of units to be at 15,000.
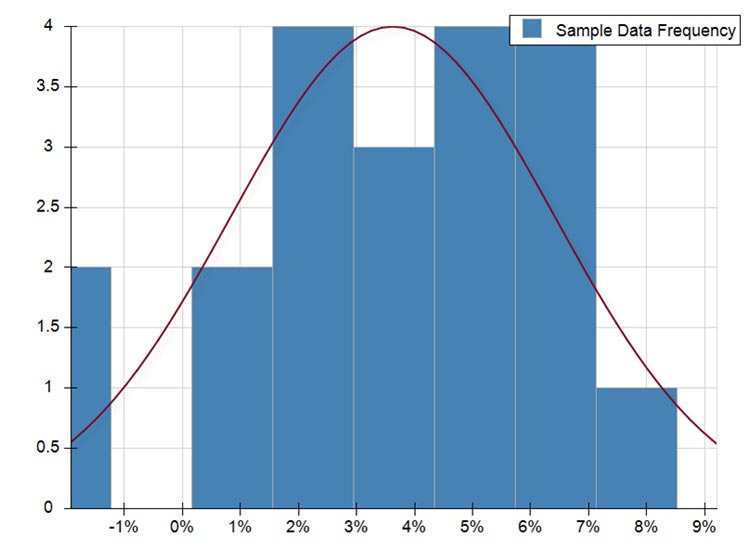
Figure 2. Annual Sales GrowthFigure 3. Future Peak Sale
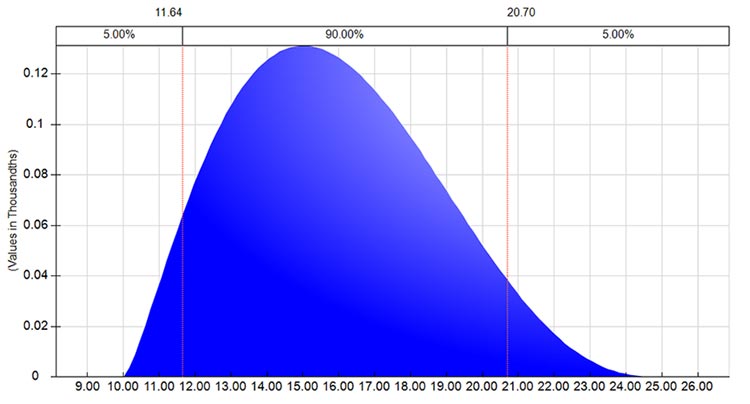
Figure 3. Future Peak Sale
It should also be noted that, wherever appropriate, relationships (often measured by linear or rank order correlations) should be considered among the different variables within a model. For instance, there typically is a strong relationship between sales and costs. Such relationships can be either estimated from the historical data, or modeled based on expert opinions, and then be incorporated in the simulation model. Including relationships within a simulation model is important, since not considering relationships in a model often results in a significant mis-estimation of risks.
For instance, stock price movements are often correlated, and the correlations can increase significantly in high volatility periods, as we have observed during the stock market correction of 2008. Mistakenly ignoring such correlations will underestimate the risks of investments in the stock market.
The next step in using a simulation model involves recalculating (also called simulating) the model thousands of times or more to generate simulated scenarios for model output (e.g., next year’s budget, Net Present Value (NPV), total project costs, etc.). All professional Excel add-ins such as Analytic Solver Simulation provide a user friendly interface for generating random samples and graphical and statistical summaries of the simulated data, making it relatively convenient to conduct simulation in spreadsheets.
The thousands of simulation scenarios are one of the main outputs of a simulation model, and provide us with an estimate of the possible future scenarios given the different risks included in the analysis. However, instead of showing management the thousands of possible future scenarios, we can use these simulated scenarios in various cases: to construct a frequency distribution of the performance measure; to compute risk measures such as expected value, percentiles and confidence intervals; to estimate the probability of the performance measure to be greater (or less) than the targeted/expected performance; and to develop potential business scenarios to evaluate. The risky budget, for example, allows senior management to gain insight into questions such as (1) how realistic is their current budget, (2) what is their confidence for meeting or exceeding the budget, and (3) and how much the budget should be set at given all the relevant uncertainties?
For the global pharmaceutical company, Figure 4 is a histogram that displays all 10,000 simulations of the 2018 OP considering all the risks and opportunities identified. As the Figure shows, based on the various risks included in the analysis, the 2018 OP could vary from less than $10M to more than $17M. In fact, while the expected (i.e., mean) OP profits are $13.5M, the company would have a 90 percent confidence that the OP would be between $11M and $16M. Figure 4 also shows that most of the simulation results for the 2018 OP are lower than the “base budget” of $15M for 2018. In fact, Figure 5, the cumulative distribution of the same 10,000 iterations, clearly shows that the company would have less than a 20 percent confidence that it would meet or exceed the $15M base budget that it originally thought was “reasonable.”
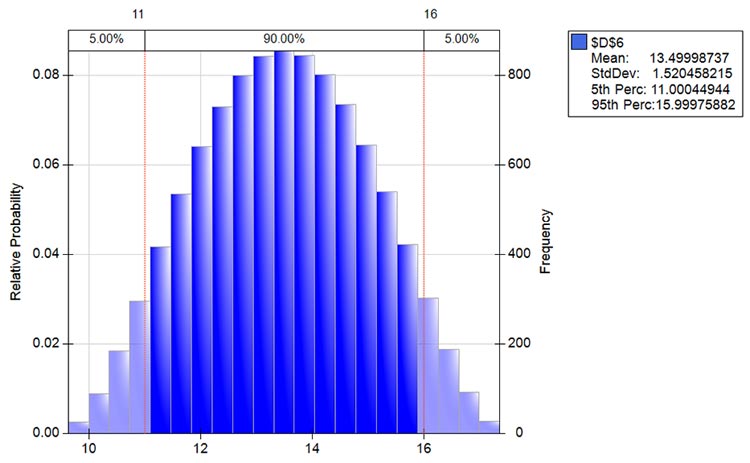
Figure 4. Histogram of SimulationsFigure 5. Cumulative Distribution of Simulations
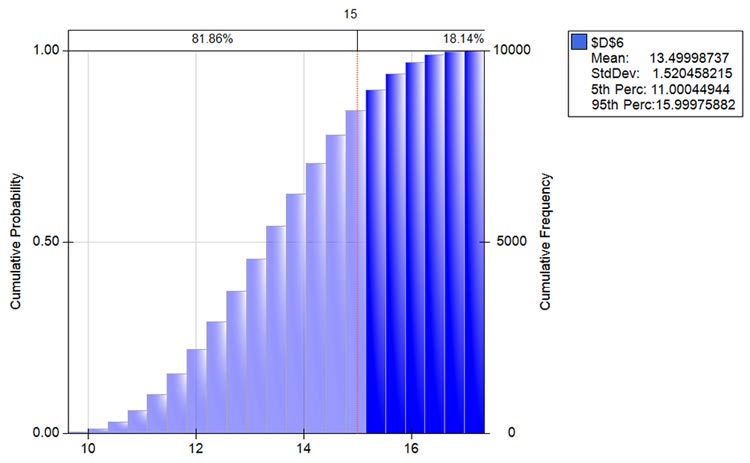
Figure 5. Cumulative Distribution of Simulations
In this example, the global pharmaceutical company’s focus is a five-year budget, thus we would develop the simulation model to consider risks affecting the OP from 2018 through 2022. As a result, Figure 6 summarizes for each of the five years. The results from the risk adjusted budget could be eye opening for the managers as the probability of achieving the company’s base five-year budget is often (much) less than 50 percent, which suggests that the budget is a stretch goal and may be unrealistic. Based on these results, management may decide to adjust the budget. In addition, the management team now would have a better understanding of how much risk there is around each of the years’ OP.
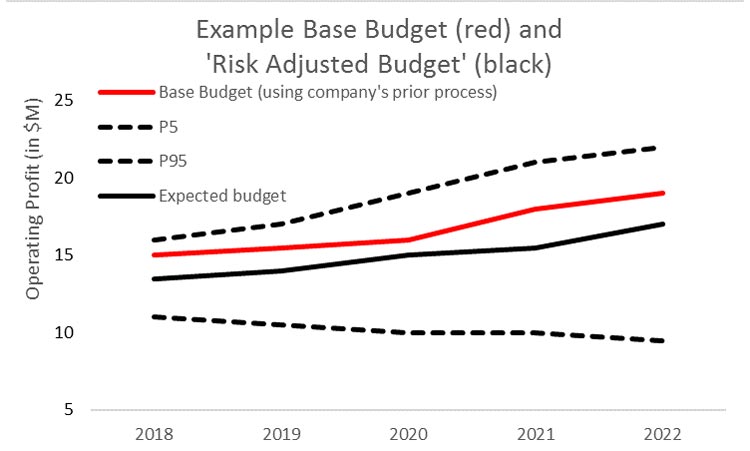
Figure 6. Risk Adjusted Budget vs. Base Budget
Monitoring Risk: Using Sensitivity Analysis
Of course, the next natural question is what uncertainties have the greatest possible impact on the budget? And what risks, if any, could be mitigated to reduce their negative impacts on the budget? If we can identify the most influential risk drivers that are driving the overall risks in, for example, next year’s OP, the company would be able to potentially work on reducing or mitigating them (e.g., spend more resources on a product to expedite the launch, or hedge the foreign exchange risk). Sensitivity analysis addresses such questions by examining how sensitive the output results are to various individual risks. One of the most frequently used sensitivity analyses in simulation modeling is a Tornado chart that visually displays the importance of each of the individual risks (e.g., product risks, regulatory risks, legal risks) to the overall risk in a company’s key metrics, such as its next year’s OP.
For instance, based on the previous example, the Tornado chart2 in Figure 7 shows two main results explaining the relative importance of each risk on the 2018 OP of the company worldwide: (1) which risks are the greatest drivers of the overall 2018 OP and (2) how much effect each of the risk drivers has on 2018 OP. The Figure clearly shows that the main four risk drivers are “regulatory risk #1,” “commercial risk #8,” “legal risk #7,” and “R&D risk #6.” In addition, it shows that “regulatory risk #1” alone could cause the 2018 OP to swing from $10.64 M to $15.25M. Having a better understanding of and potentially mitigating this regulatory risk could therefore have a considerable effect on the 2018 OP. The results of the analysis provide management and the board of directors with a better understanding of what the most important risk drivers are, and can direct management’s attention to the risks that deserve most of their focus.

Figure 7. Tornado Chart
In summary, simulation and sensitivity analysis provide a business with valuable insights into the company’s long-term risks and opportunities, and serve as a powerful tool in identifying and focusing attention on the risks and opportunities that affect budgets most significantly.
Managing Risk: Weigh Your Options
After discussing the basics, we now introduce a second example that touches more advanced topics involving options and decisions. Suppose a multinational company with specific technologies and expertise (e.g., to sell products B2B that require upfront R&D) has an ongoing challenge to find the right balance of risk and reward in agreements with business partners. Agreements can be kept as simple as a supply agreement where the supplier is paid for cost plus a markup or made more complex where a supplier takes on a greater share of the cost and risk, and in return, shares the profit margin of the final product.
Simulation can be a powerful decision-supporting tool to understand the risk-reward picture of alternative partnership agreements: product/business development, private equity/venture capital, joint ventures, etc. Even though the way partnership agreements are structured can greatly influence a business’ risk/reward profile, often businesses only quantify the “most likely” rewards (e.g., NPV, IRR, sales), and not the risks.
In comparison, using Monte Carlo simulation, we can develop risk assessment tools and simulation models to analyze both the risks and potential rewards of pursuing a variety of different partnership agreements and business models. Such quantitative tools would transparently and consistently quantify the risk/reward trade-off, and provide clarity and insight into alternative partnership structures and business models. This will greatly assist the company in deciding which opportunities to pursue, and what partnership agreements to negotiate.
As we discussed previously, first we must gain a good understanding of the main risks and uncertainties that impact the financial risks and returns of the opportunity in question. In this example, risks can be wide-ranging but often include R&D uncertainties, market size, competition and market share, legal landscape, costs, and timelines. The next step is to build a risk-based financial profit and loss (P&L) and a cash flow model that incorporates all identified risks and uncertainties, with all relationships between the risks, and importantly, does not over-complicate the models.
Once the financial returns and risks are incorporated in the P&L model, the model then “overlays” the various relevant partnership agreement structures or business models, resulting in a full simulation risk analysis of each alternative “business partnership structure.” A great strength of this approach is that the results include risk and decision insights on the individual strategic opportunity as well as the various agreement structures.
Figure 8 shows an example of some of the results of the analysis for this company under three different agreement structures. In Figure 9, the dots represent the expected “risked NPV” and the error bars show the amount of risk under each structure. The appeal of each option depends on how risk averse you and your potential partner are, what the individual risks are and how they are shared with your partner, and how much risk the rest of your product portfolio has. In other words, to make an informed decision on the strategy of one product, it is important to understand the risks in the rest of the organization’s portfolio. Similarly, while not shown here since this analysis is based on a simulation model, a Tornado chart can show the main risk drivers and help the company in focusing on how to best potentially understand and mitigate risks in the partnership agreement.
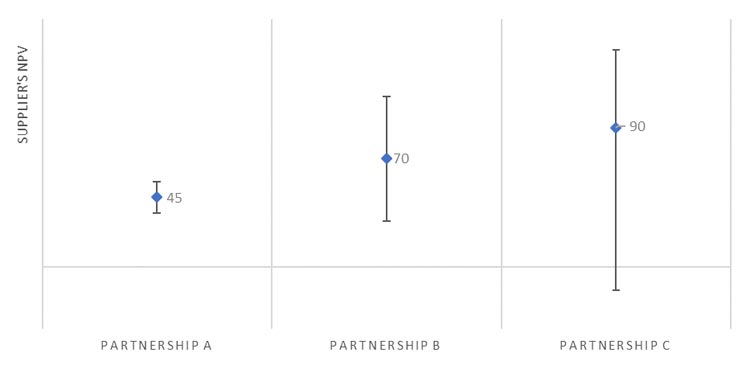
Figure 8. Different Partnership StructureFigure 9. Risked NPV under Each Partnership
Many Applications
The authors have successfully applied risk analysis methods in hundreds of projects in fields ranging from pharmaceuticals, oil and gas, finance, manufacturing, and mining to food and beverages, health and food safety. We used and gained our analytical expertise in helping private and public institutions worldwide to make decisions in the presence of uncertainty. The following are several additional applications of Monte Carlo simulation to improve decision making.
A large international firm wishes to evaluate the risks and rewards of a potential large business-development deal. The complicating factor is that the proposed M&A contract allows either of the two parties involved to change the business terms, after the deal is signed (i.e., “flip” the terms). A Monte Carlo simulation model can capture the operational, commercial, and financial risks of the deal, as well as the “optionality” within the potential M&A deal-terms, and allows the client to take a more favorable negotiation strategy that can result in a successful licensing deal.
A venture capital firm is in the process of structuring a new fund. The firm needs to determine the optimal distribution structure of the different future cash flows to various stakeholders (entrepreneurs, investors, and general partners), taking risks into account. A comprehensive Monte Carlo model that simulates the investment performance, and relates various cash flow streams, will help the managing director better understand the risks to each of the stakeholders involved under the different fund structures and scenarios, support the decisions on how to structure the fund, and give investors a quantitative view of risk and return.
A gas transmission and storage company manages the large cost of several projects’ costs and schedules. The managers wonder if there is a better way to understand and manage risks. Monte Carlo simulation would provide the company with better insight about the project and its risks.
Using Simulation Successfully
While Monte Carlo simulation can have great advantages in making better informed decisions, there are still many organizations that have not utilized it to its advantage. In our experience with many diverse companies and organizations worldwide, we have found the following three factors to be critical for the successful and continuous use of simulation modeling:
Support from senior management: Senior management’s interest in, and support for the use of simulation modeling to improve decision making is critically important. While there are multiple ways of obtaining and maintaining such support, an effective approach we’ve frequently employed is with one or a couple of important (visible) example projects in which the benefits of simulation model can be effectively shown.
Making simulation modeling an integral part of the decision making process: To benefit from the advantages of Monte Carlo simulation, its usage should be made part of the regular decision-making process (as stated in #1, its use should be demanded by management). This means it should, of course, not be a substitute for business professionals learning with and from real business contexts but instead as a way of enhancing your decision-making. For decisions that are made regularly (e.g., investment decisions), the use of templates can often facilitate and speed this up. One of the companies we’ve collaborated with has made a Monte Carlo analysis mandatory for the review/approval of every capex project over $5M.
Developing and gaining expertise: To achieve credible simulation results, the model must closely resemble the reality, while also keeping the model conceptually tractable. The decision for the right level of detail, a suitable model structure, and valid inputs all require expert experience with the implementation of simulation models. This means that obtaining the right expertise and skills to develop and use simulation model is critically important.
Organizations that do get the right support, processes and skills in place can expect a true competitive advantage though in making more informed decisions.
Summary
We’ve discussed the importance of risk analysis and risk management using Monte Carlo simulation. In business, risk is everywhere. “Man is a deterministic device thrown into a probabilistic Universe. In this match, surprises are expected.”3 Simulation modeling can help organizations better navigate the business oceans with unexpected icebergs. In the end, what separates successful businesses from those that fail is the attention to risk and the capability to manage it.
Resources
ModelAssist: A free and comprehensive quantitative risk analysis training and reference software. https://modelassist.epixanalytics.com/
Practical Spreadsheet Risk Modeling for Management, Lehman, D, Groenendaal, H and G. Nolder. Chapman and Hall/CRC, September 1, 2011. Hardback textbook, 284 pages.
Footnotes
1 See Solver International’s premier issue, July 2017, which has a great introductory guide on modeling risks with Monte Carlo simulation.
2 There are various versions of Tornado charts available, but all are focused on the question of what the main risk drivers are towards a certain objective such as a 2018 OP, total costs of a project, NPV, etc.
3 Quote by Amos Tversky, in “The Undoing Project” by Michael Lewis