Using Discriminant Analysis
See below for an explanation of options on all four tabs of the Discriminant Analysis (DA) dialog: Data, Parameters, Scoring and Simulation.
The following options appear on all four tabs of the Discriminant Analysis dialog.

Help: Click the Help button to access documentation on all Discriminant Analysis options.
Cancel: Click the Cancel button to close the dialog without running Discriminant Analysis.
Next: Click the Next button to advance to the next tab.
Finish: Click Finish to accept all option settings on all dialogs, and run Discriminant Analysis.
Discriminant Analysis Data Tab
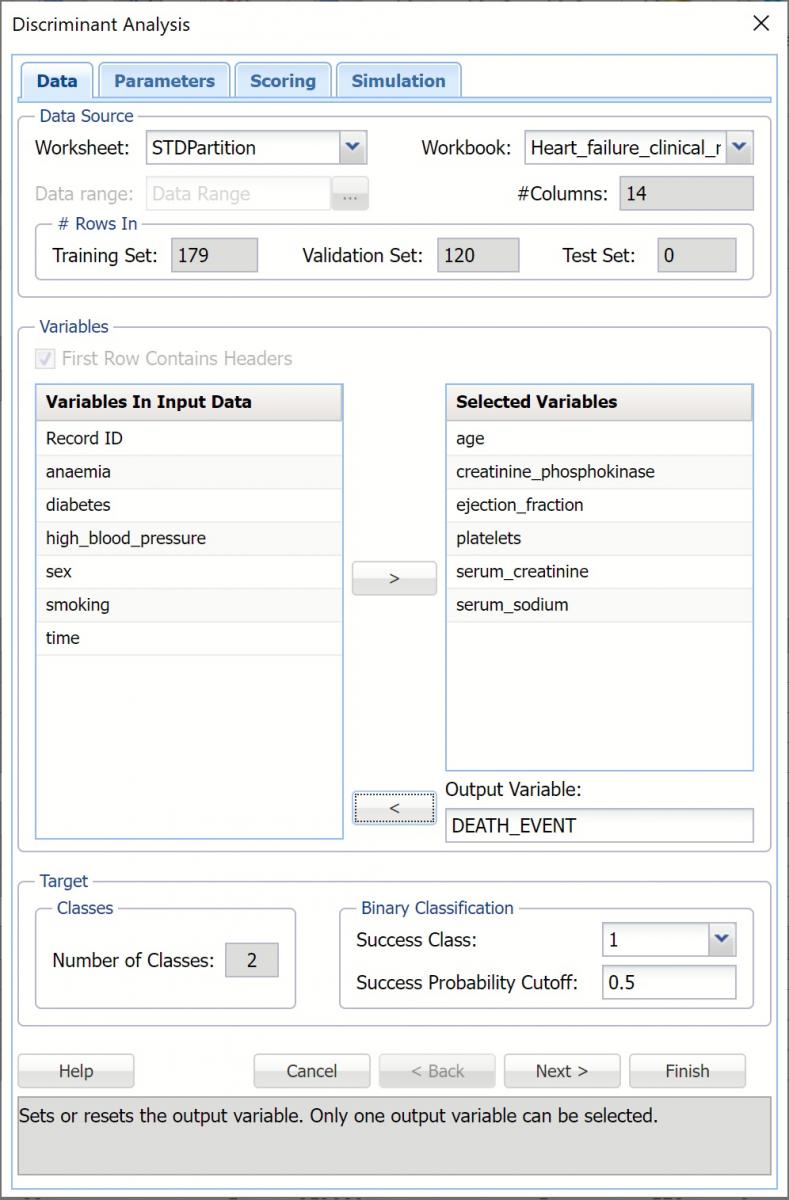
Data Source
Worksheet: Click the down arrow to select the desired worksheet where the dataset is contained.
Workbook: Click the down arrow to select the desired workbook where the dataset is contained.
Data range: Select or enter the desired data range within the dataset. This data range may either be a portion of the dataset or the complete dataset.
#Columns: Displays the number of columns in the data range. This option is read only.
#Rows In: Training Set, Validation Set, Test Set: Displays the number of rows in each partition, if it exists. This option is read only.
Variables
First Row Contains Headers: Select this checkbox if the first row in the dataset contains column headings.
Variables In Input Data: This field contains the list of the variables, or features, included in the data range.
Selected Variables: This field contains the list of variables, or features, to be included in DA.
- To include a variable in DA, select the variable in the Variables In Input Data list, then click the upper > to move the variable to the Selected Variables list.
- To remove a variable as a selected variable, click the variable in the Selected Variables list, then click the upper < to move the variable back to the Variables In Input Data list.
Output Variable: The selected output variable is displayed here.
- To select the output variable (required), select the variable in the Variables In Input Data list, then click the lower > to move the variable to the Output Variable field.
- To remove the output variable, click < to move the variable back to the Variables In Input Data list.
Number of Classes
(Read Only) This value is the number of classes in the output variable.
Binary Classification
Set the Success Class and the Success Probability Cutoff here.
Success Class: This option is selected by default. Select the class to be considered a “success” or the significant class in the Lift Chart. This option is enabled when the number of classes in the output variable is equal to 2.
Success Probability Cutoff: Enter a value between 0 and 1 here to denote the cutoff probability for success. If the calculated probability for success for an observation is greater than or equal to this value, than a “success” (or a 1) will be predicted for that observation. If the calculated probability for success for an observation is less than this value, then a “non-success” (or a 0) will be predicted for that observation. The default value is 0.5. This option is only enabled when the # of classes is equal to 2.
Discriminant Analysis dialog, Parameters tab
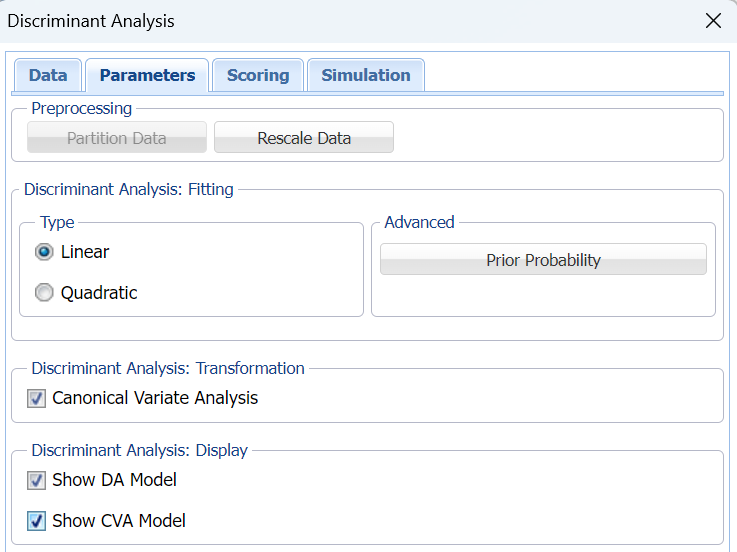
Preprocessing
Partition Data
Analytic Solver Data Science includes the ability to partition a dataset from within a classification or prediction method by clicking Partition Data on the Parameters tab. Analytic Solver Data Science will partition your dataset (according to the partition options you set) immediately before running the classification method. If partitioning has already occurred on the dataset, this option will be disabled. For more information on partitioning, please see the Data Science Partitioning chapter.
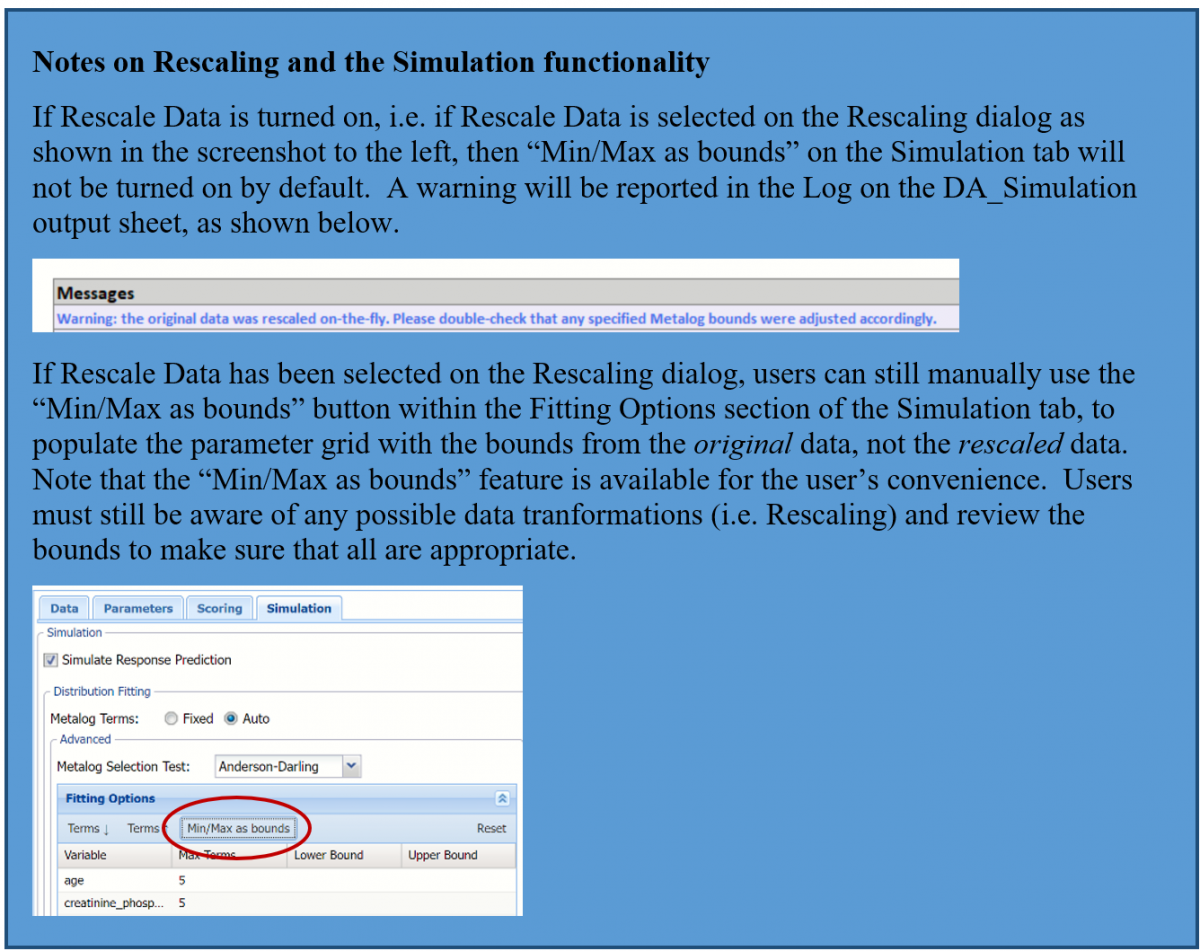
Rescale Data
Use Rescaling to normalize one or more features in your data during the data preprocessing stage. Analytic Solver Data Science provides the following methods for feature scaling: Standardization, Normalization, Adjusted Normalization and Unit Norm. For more information on this new feature, see the Rescale Continuous Data section within the Transform Continuous Data chapter that occurs earlier in this guide.
Prior Probability
Click Prior Probability to open the dialog below. Three options appear in the Prior Probability Dialog: Empirical, Uniform and Manual.
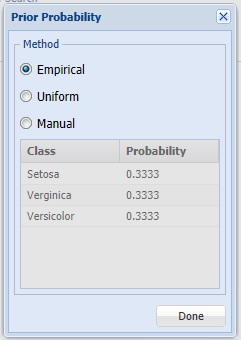
- If the first option is selected, Empirical, Analytic Solver Data Science will assume that the probability of encountering a particular class in the dataset is the same as the frequency with which it occurs in the training data.
- If the second option is selected, Uniform, Analytic Solver Data Science will assume that all classes occur with equal probability.
- Select the third option, Manual, to manually enter the desired probability for each class. Probabilities must sum up to 1.
Type: Quadratic or Linear
Discriminant analysis assumes that:
- The data is normally distributed.
- Means of each class are specific to that class.
- All classes have a common covariance matrix.
If these assumptions are realized, DA generates a linear decision boundary.
The latest version of Analytic Solver Data Science now contains Quadratic Discriminant Analysis (QDA). QDA produces a quadratic decision boundary, rather than a linear decision boundary. While QDA also assumes that the data is normally distributed, QDA does not assume that all classes share the same covariance matrix.
QDA is a more flexible technique when compared to LDA. QDA's performance improves over LDA when the class covariance matrices are disparate. Since each class has a different covariance matrix, the number of parameters that must be estimated increases significantly as the number of dimensions (predictors) increase. As a result, LDA might be a better choice over QDA on datasets with small numbers of observations and large numbers of classes. It’s advisable to try both techniques to determine which one performs best on your model. You can easily switch between LDA and QDA simply by setting this option to linear or quadratic.
Canonical Variate Analysis
When this option is selected, Analytic Solver Data Science produces the canonical variates for the data based on an orthogonal representation of the original variates and sends them to the output sheets, DA_TrainingCanScores (for the training partition), DA_ValidationCanScores (for the validation partition) and DA_TestCanScores (for the test partition). This has the effect of choosing a representation which maximizes the distance between the different groups. For a k class problem there are k-1 Canonical variates. Typically, only a subset of the canonical variates is sufficient to discriminate between the classes. For this example, we have two canonical variates which means that if we replace the four original predictors by just two predictors, X1 and X2, (which are actually linear combinations of the four original predictors) the discrimination based on these two predictors will perform just as well as the discrimination based on the original predictors.
Discriminant Model Display
Show CVA Model
When Canonical Variate Analysis is selected, Show CVA Model is enabled. Select this option to produce the Canonical Variates in the output.
Show DA Model
Select this option to display the functions that define each class in the output.
Discriminant Analysis, Scoring Tab
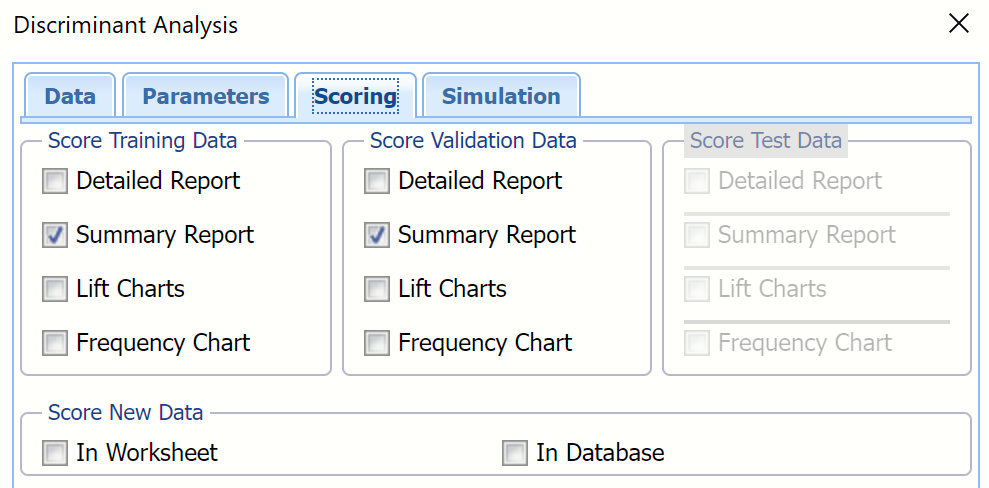
Score Training Data
Select these options to show an assessment of the performance of the Discriminant Analysis algorithm in classifying the training data. The report is displayed according to your specifications - Detailed, Summary, and Lift charts. Lift charts are only available when the Output Variable contains 2 categories.
When Frequency Chart is selected, a frequency chart will be displayed when the DA_TrainingScore worksheet is selected. This chart will display an interactive application similar to the Analyze Data feature, explained in detail in the Analyze Data chapter that appears earlier in this guide. This chart will include frequency distributions of the actual and predicted responses individually, or side-by-side, depending on the user’s preference, as well as basic and advanced statistics for variables, percentiles, six sigma indices.
Score Validation Data
These options are enabled when a validation data set is present. Select these options to show an assessment of the performance of the Discriminant Analysis algorithm in classifying the validation data. The report is displayed according to your specifications - Detailed, Summary, and Lift charts. Lift charts are only available when the Output Variable contains 2 categories. When Frequency Chart is selected, a frequency chart (described above) will be displayed when the DA_ValidationScore worksheet is selected.
Score Test Data
These options are enabled when a test set is present. Select these options to show an assessment of the performance of the Discriminant Analysis algorithm in classifying the test data. The report is displayed according to your specifications - Detailed, Summary, and Lift charts. Lift charts are only available when the Output Variable contains 2 categories. When Frequency Chart is selected, a frequency chart (described above) will be displayed when the DA_TestScore worksheet is selected.
Score New Data
See the Scoring chapter within the Analytic Solver Data Science User Guide for more information on the options located in the Score Test Data and Score New Data groups.
Discriminant Analysis, Simulation Tab
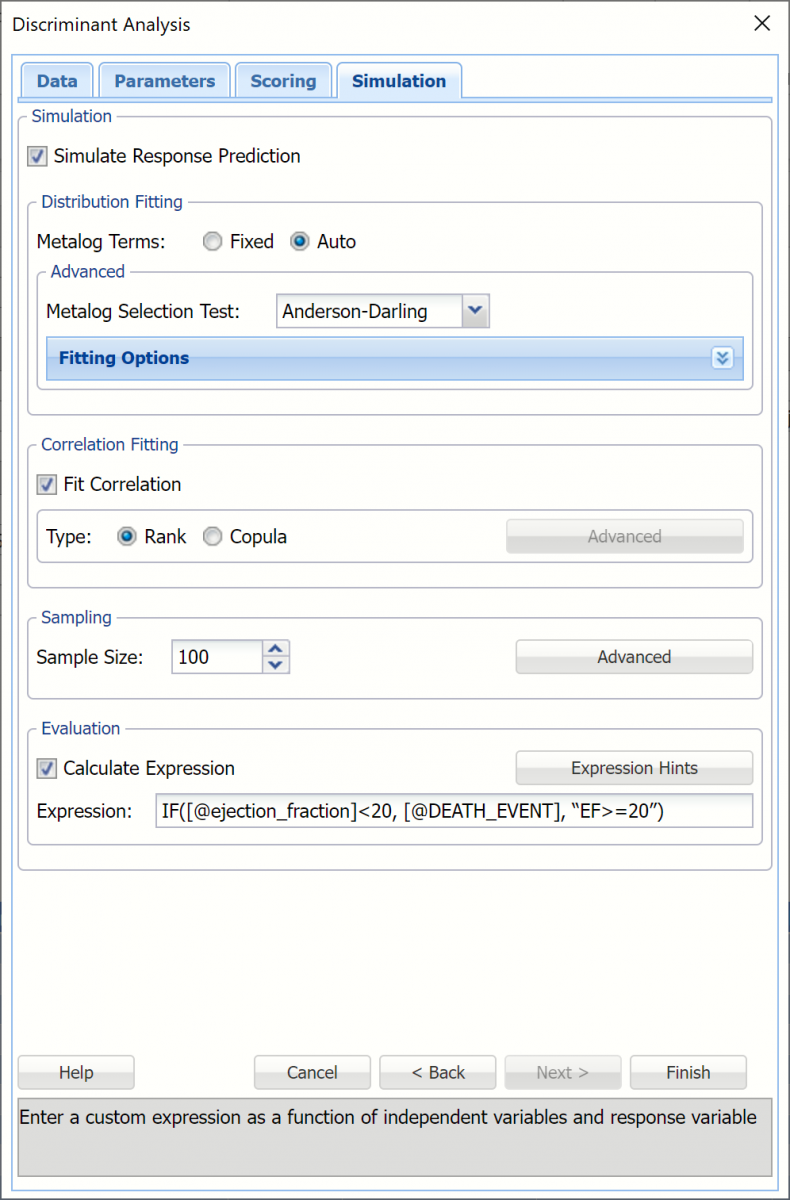
All supervised algorithms include a new Simulation tab. This tab uses the functionality from the Generate Data feature (described earlier in this guide) to generate synthetic data based on the training partition, and uses the fitted model to produce predictions for the synthetic data. The resulting report, DA_Simulation, will contain the synthetic data, the predicted values and the Excel-calculated Expression column, if present. In addition, frequency charts containing the Prediction (Simulation)/Prediction (Training) or Expression (Simulation)/Expression (Training) sources or a combination of any pair may be viewed, if the charts are of the same type (scale or categorical). Check Simulate Response Prediction to enable the options on the Simulation tab.
Evaluation: Select Calculate Expression to amend an Expression column onto the frequency chart displayed on the DA_Simulation output tab. Expression can be any valid Excel formula that references a variable and the response as [@COLUMN_NAME]. Click the Expression Hints button for more information on entering an expression.