The next four examples illustrate usage of the binning utility included within Analytic Solver Data Science. These examples all use the dataset within Binning_Example.xlsx. Open Binning_Example.xlsx by clicking Help – Example Models, then Forecasting/Data Science Examples – Binning_Example.xlsx. A portion of the dataset is shown below.

Click Transform -- Transform Continuous Data – Bin on the Desktop Data Science ribbon or Transform – Bin Continuous Data on the Cloud app Ribbon, to open the Bin Continuous Data dialog.
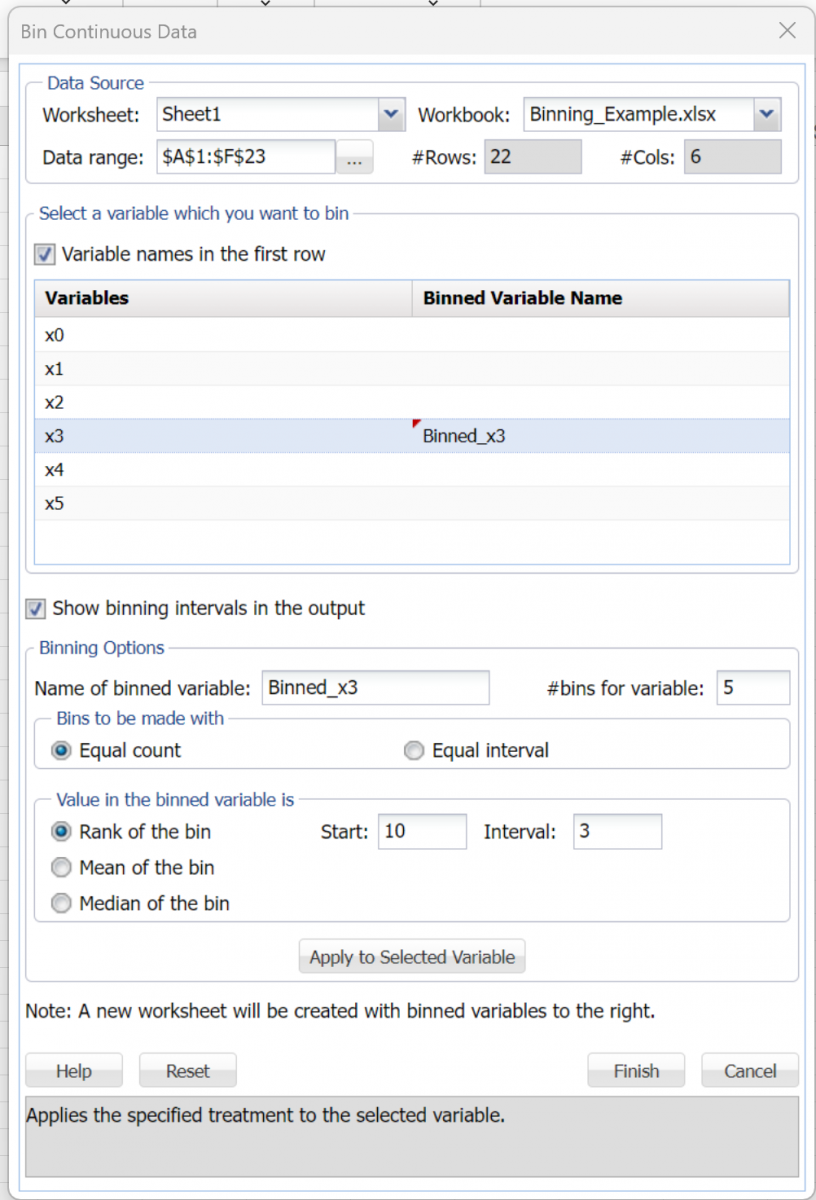
Select x3 in the Variables field. The options are immediately activated. Enter 5 for #bins for variable. Under Value in the binned variable is, enter 10 for Start and 3 for Interval, then click Apply to selected variable. The variable, x3, will appear in the field labeled, Binned Variable Name.
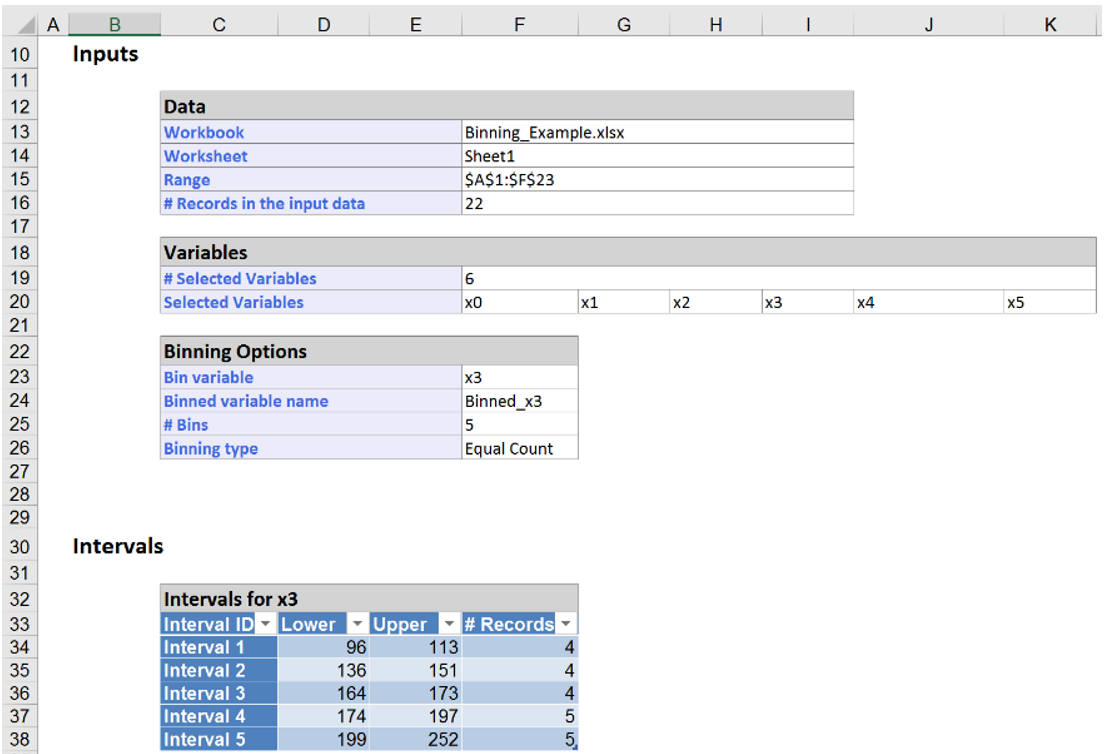
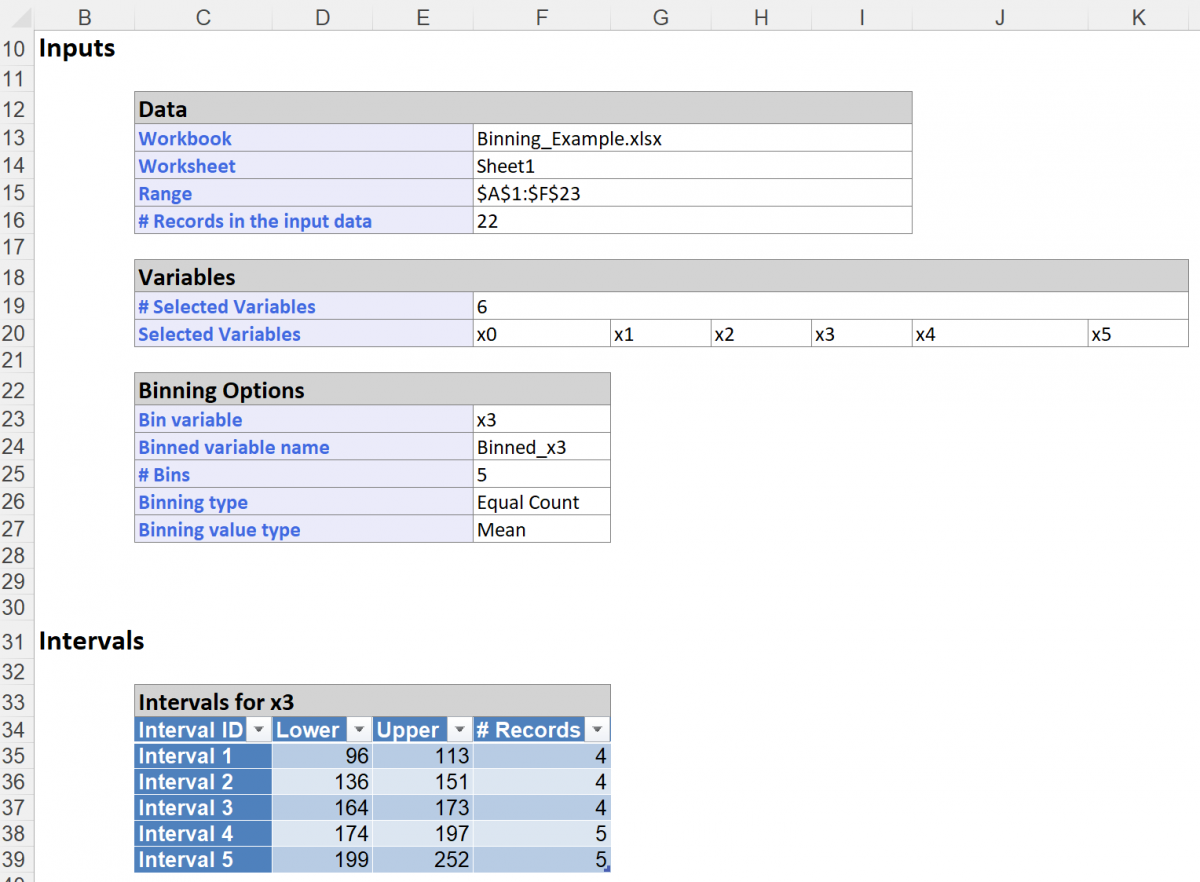
Now click Finish. Analytic Solver Data Science reports the binning intervals in the Bin_Output. This report (pictured below), displays the number of intervals, or bins, created, along with the lower value, upper value and number of records assigned to each bin. As specified, 5 bins, or intervals, were created.
Click Bin_Transform to see the records assigned to each bin.
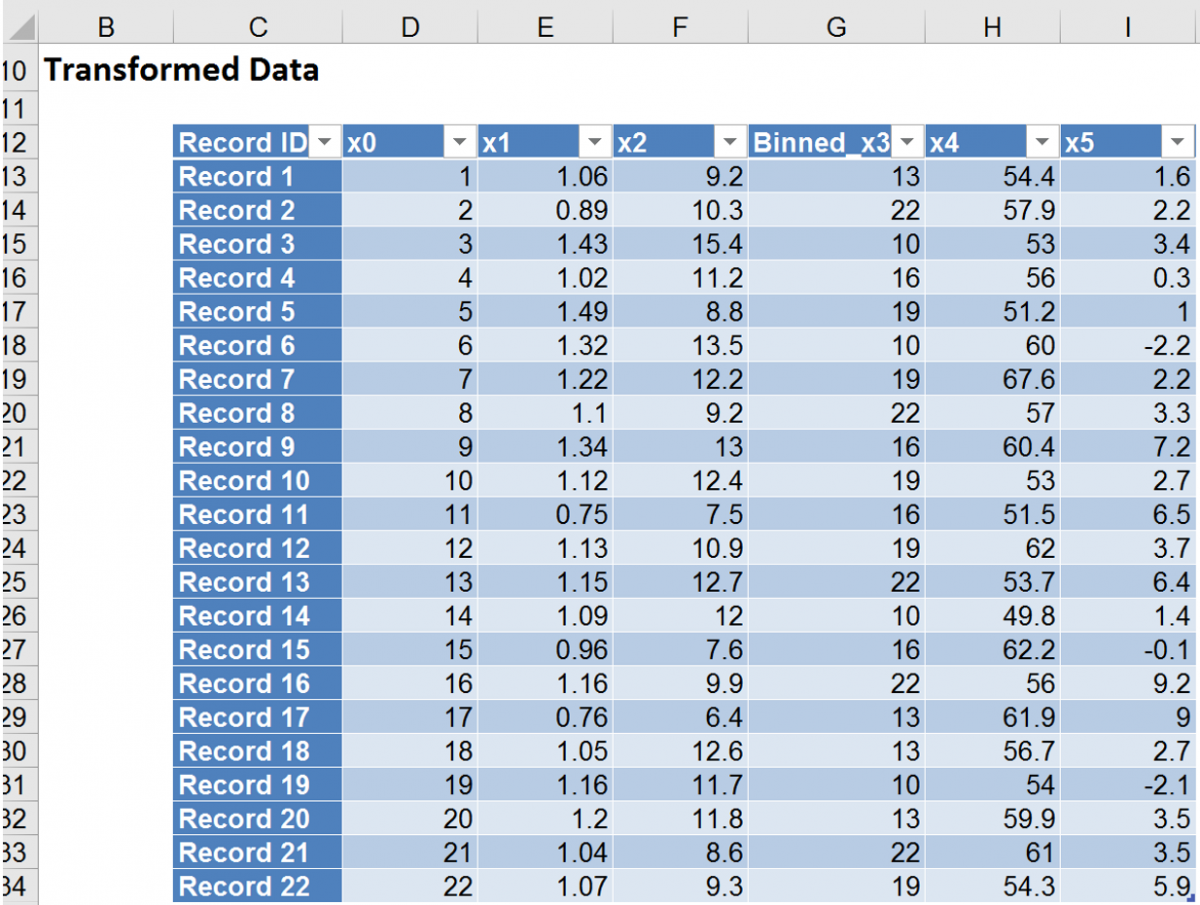
As specified, 5 bins were created for the Binned_x3 variable starting with a rank of 10 and an interval of 3: 10, 13 (10 + 3), 16 (13 + 3), 19 (16 + 3), and 22 (19 + 3). The first four smallest values (96, 104, 111, 113 in records 14, 19, 6, and 3, respectively) have been assigned to Bin 10. The next four values in ascending order (136, 148, 150, 151 in records 17, 20, 18, and 1, respectively) have been assigned to Bin 13. The next four values in ascending order (164, 168, 168, 173 in records 15, 9, 4, and 11, respectively) have been assigned to Bin 16. The next five values in ascending order (174, 175, 178, 192, 197 in records 22, 7, 12, 5, and 10, respectively) have been assigned to Bin 19 and the last five values (199, 202, 204, 245, 252 in records 13, 2, 21, 8, and 16, respectively) have been assigned to Bin 22.
Though Binning Type is set to Equal Count, the number of records in each interval may not be essentially the same. Factors such as border values, total number of records, etc. influence the number of records assigned to each bin.
The next example bins the value of the variable to the mean of the bin rather than the rank of the bin.
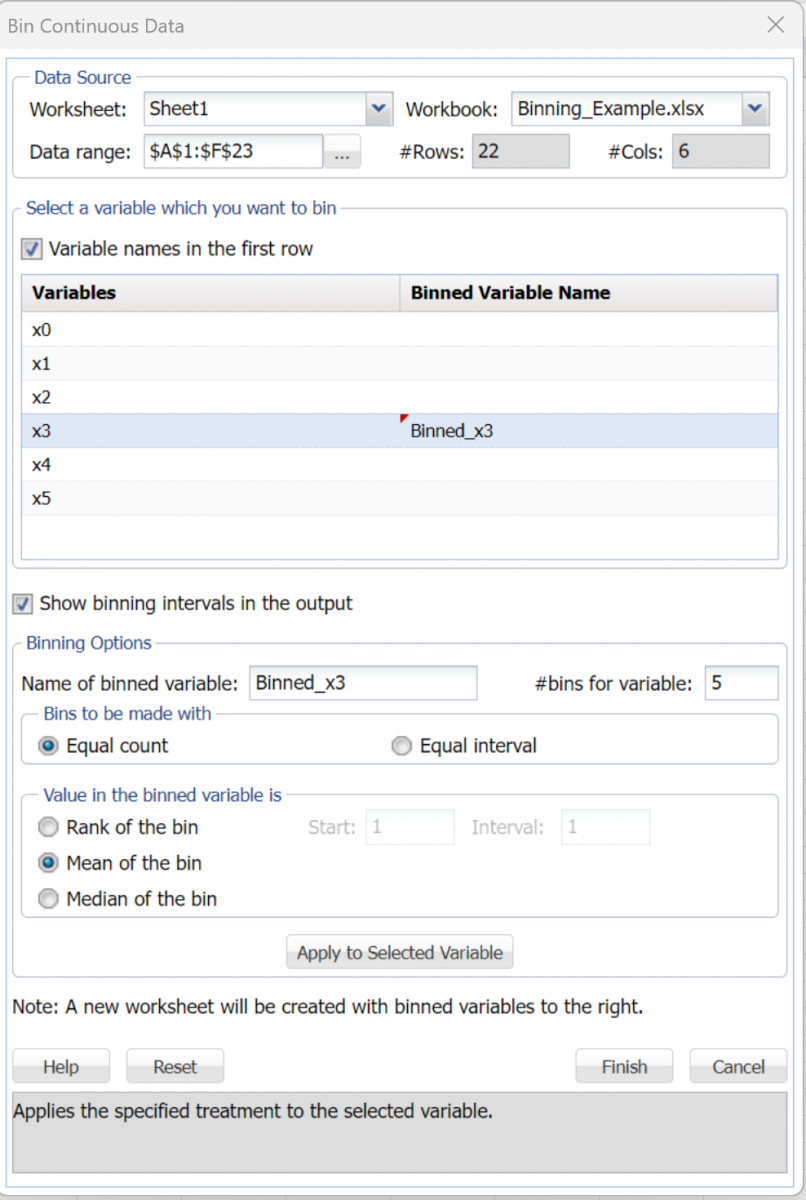
Click back to Sheet1 and open the Bin Continuous Data dialog. Select variable “x3”, then select Mean of the bin, rather than Rank of the bin, for Value in the binned variable is. Again enter 5 for #bins for variable. Click Apply to selected variable then click Finish.
The Bin_Output1 worksheet displays the number of bins created, the minimum and maximum values and the number of records assigned to each bin.
Click the Bin_Transform1 output sheet.
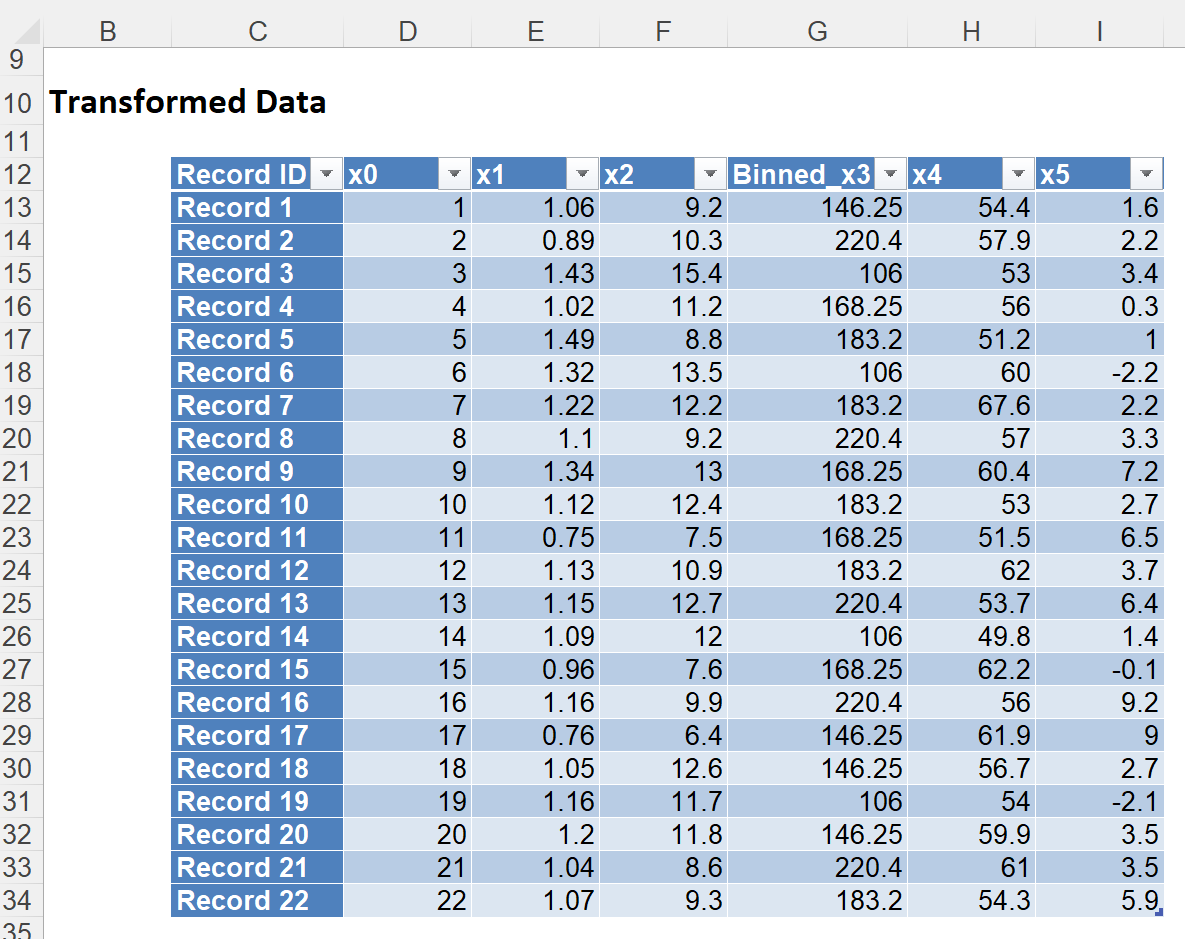
In the output, the Binned_x3 variable is equal to the mean of all the x3 variables assigned to that bin. Let’s take the first record for an example. Recall, from the previous example, the values from Bin 13: 136, 148, 150, 151. The mean of these values is 146.25 ((136 + 148 + 150 + 151) / 4) which is the value for the Binned_x3 variable for the first record.
Similarly, if we were to select the Median of the bin option, the Binned_x3 variable would equal the median of all x3 variables assigned to each bin.
The next example explores the Equal interval option.
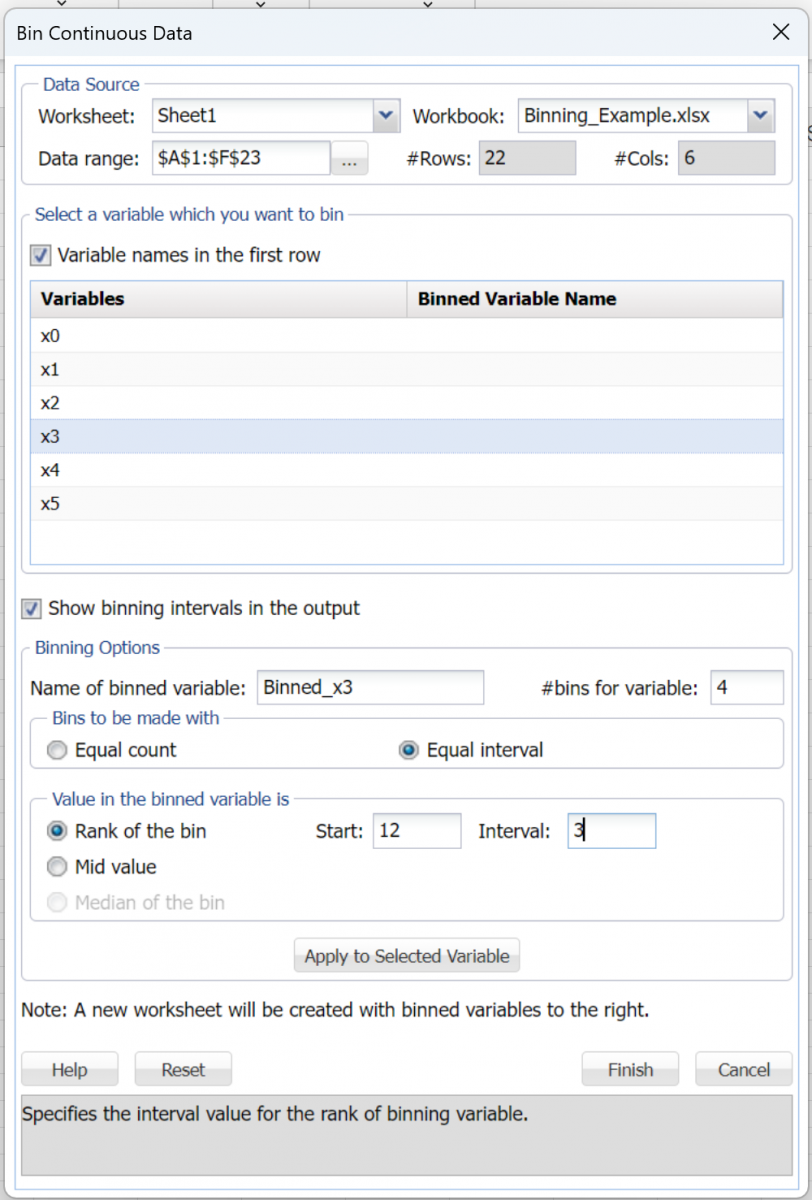
Click back to Sheet1 and open the Bin Continuous Data dialog. Select x3 in the Variables field, enter 4 for #bins for variable, select Equal interval under Bins to be made with, enter 12 for Start and 3 for Interval under Value in the binned variable is, then click Apply to selected variable.
Then click Finish.
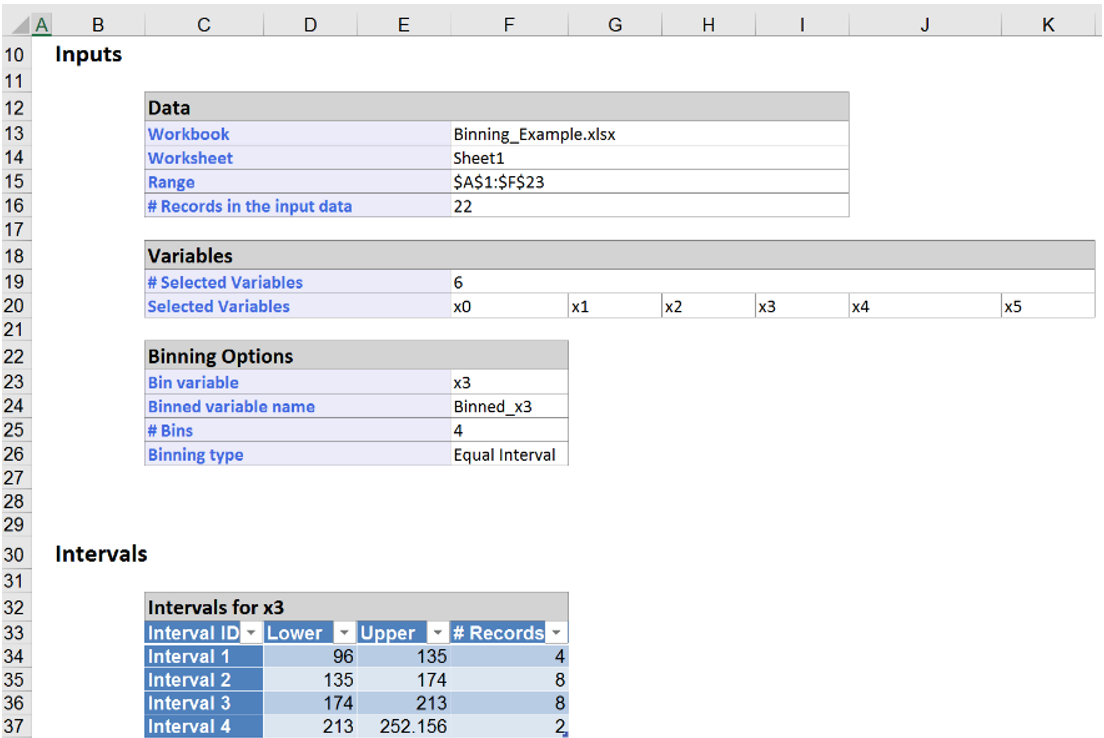
The Bin_Ouput3 worksheet displays the 4 intervals and the number of records along with the range of values assigned to each bin: Bin 1 (96 to 135), Bin 2 (135 – 174), Bin 3 (174 – 213), and Bin 4 (213 – 252).
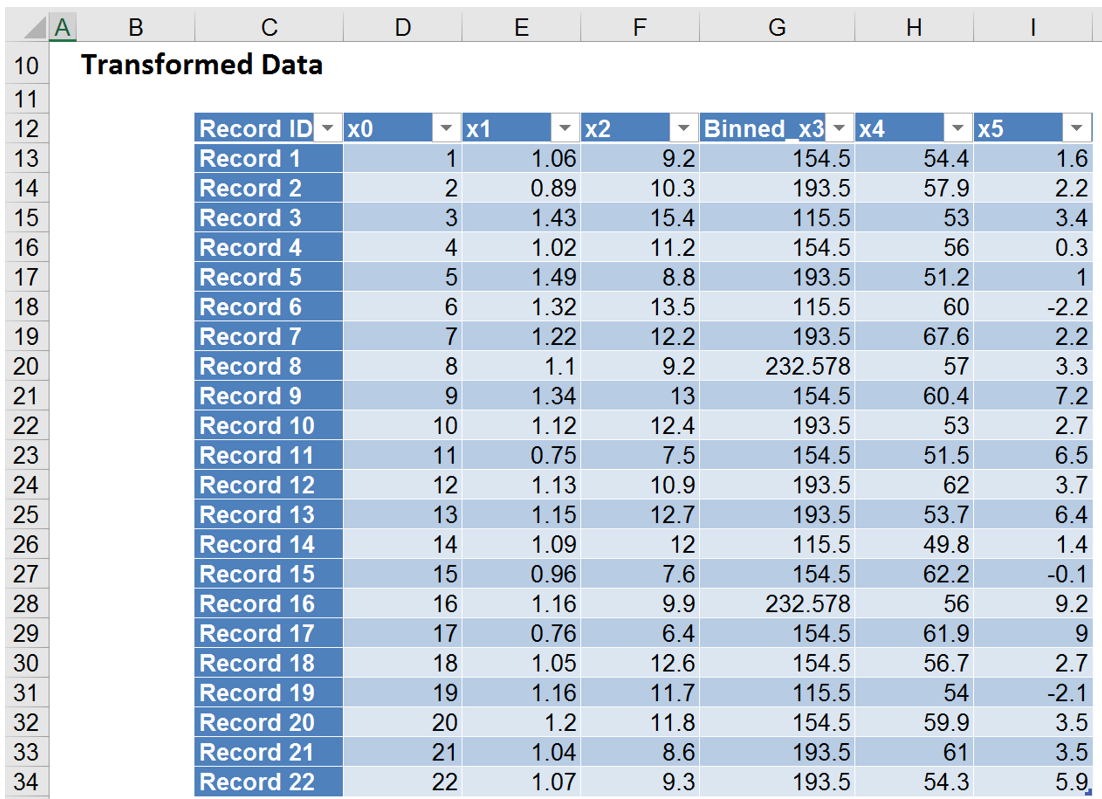
The output sheet, Bin_Transform3, shows us which records have been assigned to each of the 4 bins. The value of the binned variable is the midpoint of each interval: 115.5 for Bin 1, 154.5 for Bin 2, 193.5 for Bin 3 and 232.5 for Bin 4. In the first record, x3’s value is 154.4. Since this value lies in the interval for Bin 2 (135 – 174) the mid value of this interval is reported for the Binned_x3 variable, 154.5. In the last record, x3’s value is 193.5. Since this value lies in the interval for Bin 3 (174 – 213), the mid value of this interval is reported for the Binned_x3 variable, 193.5.