The Fourier Analysis tool calculates the discrete Fourier transform (DFT) or it's inverse for a vector (column).
This tool computes the discrete Fourier transform (DFT) of the given vector (column) using the Cooley-Tukey decimation-in-time radix-2 algorithm. The vector's length must be a power of 2.
This tool can also compute the inverse discrete Fourier transform (IDFT) of the given complex vector. This vector can have any length. Note: This transform does not perform scaling, so the inverse is not a true inverse.
Below is a random series of 0's and 1's simulating a binary signal.

To run the Fourier Analysis:
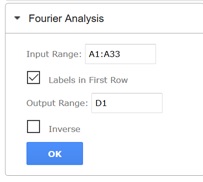
- On the XLMiner Analysis ToolPak pane, click Fourier Analysis
- Enter A1:A33 for Input Range. Note: The number of values entered in this argument must be of a size equal to the power of 2, i.e., 2 (2^1), 4 (2^2), 8 (2^3), 16 (2^4), 32 (2^5), 64 (2^6), etc.
- Keep "Labels in First Row" selected since Dataset appears in cell A1.
- Enter D1 for Output Range.
- Click OK.
Note: To compute the inverse discrete Fourier transform of a vector, select Inverse on the pane.

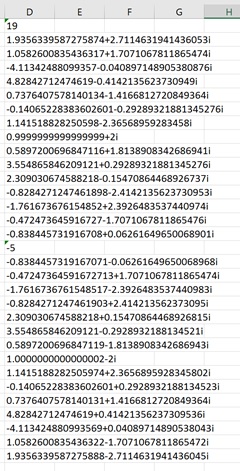
The results are below.

Since the input range included 32 data points, the output also includes 32 points. These points represent a curve that is the amplitude frequency spectrum of the input range.
A complete description of this algorithm and its results is beyond the scope of this guide. For more information, consult standard physics reference texts or articles on the Fourier Transformation.
