Interactive Simulation with Charts and Graphs
Interactive Simulation makes Risk Solver fundamentally different from other Monte Carlo simulation tools for Excel. The kinds of charts we’ve just seen can be produced by other tools, but only at the end of a “simulation run.” In contrast, Risk Solver makes these charts live as you play what-if with your model.
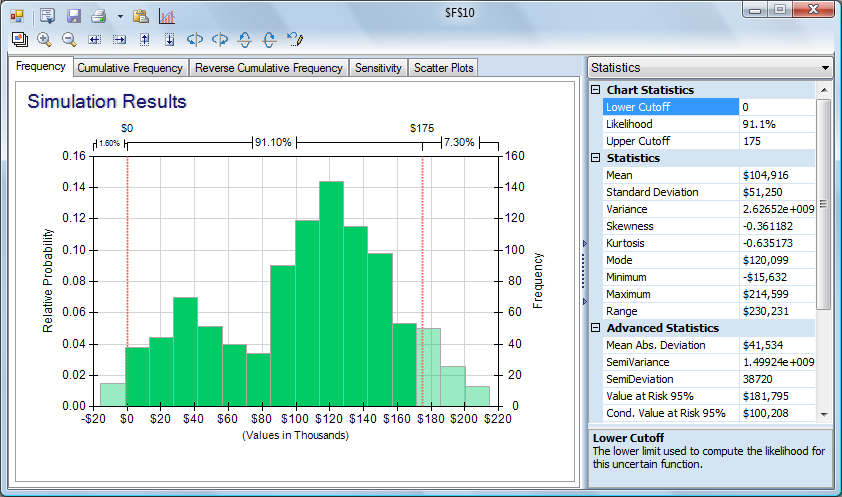
After seeing this model, your production manager might think of a way to reduce the maximum Unit Cost to $7.00 instead of $7.50. What would be the impact of this change on Net Profit, over the full range outcomes? With Risk Solver, this is as easy as any other 'what-if’ question in Excel. We click the Frequency tab in the Uncertain Function to re-display the frequency chart of outcomes for cell F10. Then simply change the number in cell B11-- the high end of the Unit Cost distribution -- from 7.50 to 7.00. (The other parameters of our triangular distribution -- low $5.50, most likely $6.50 -- haven't changed.) Immediately, a thousand Monte Carlo trials are performed, and the chart is updated. The effect is striking: We have a 98.4% chance of making a profit, and -- checking the Statistics pane -- we see that instead of a worst-case loss of -$66,869, we have a worst-case loss of only -$15,632!
The original spreadsheet 'Flawed Average' model presented a limited and misleading picture of this business situation. In contrast, the Risk Solver model has illuminated the situation considerably. We can see what can go right, and what can go wrong. We can make an informed decision about whether the reward is worth the risk. And -- most important -- we can interactively explore ways to improve the reward and reduce the risk. This is risk analysis and risk management at work.
We've now progressed all the way through the process of building a simulation model and using Monte Carlo simulation for risk analysis and decision-making. But most often, completing the analysis doesn't mean we are finished -- we must present our results to others. And this example model was very small -- most realistic models will contain many more uncertain variables and functions, statistics, correlations and other features. We'll explore how Risk Solver can help us with these issues in two concluding pages.
< Back to: Monte Carlo Simulation Tutorial StartNext: Charts and Graphs for Presentations >