Statistics and Percentiles
So far in our business forecast risk model, we've looked at charts of the full range of Net Profit outcomes, in the form of a frequency bar chart. As shown below, the Statistics pane in theUncertain Function dialog provides a variety of statistics for the current set of simulation trials. For instance, we see that the minimum and maximum net profit values were -$66,869 and $211,052, respectively. (These same statistics could be computed in the spreadsheet using PsiMin(F10) and PsiMax(F10), respectively.) The Value at Risk 95% statistic shows that we have a 5% chance of making $173,752 or more, and the Conditional Value at Risk 95% statistic shows that the average of all the observed Net Profit values below the VaR 95% level is $87,454. (These same statistics could be computed in the spreadsheet using PsiBVar(F10,0.95) and PsiCVar(F10,0.95), respectively.)
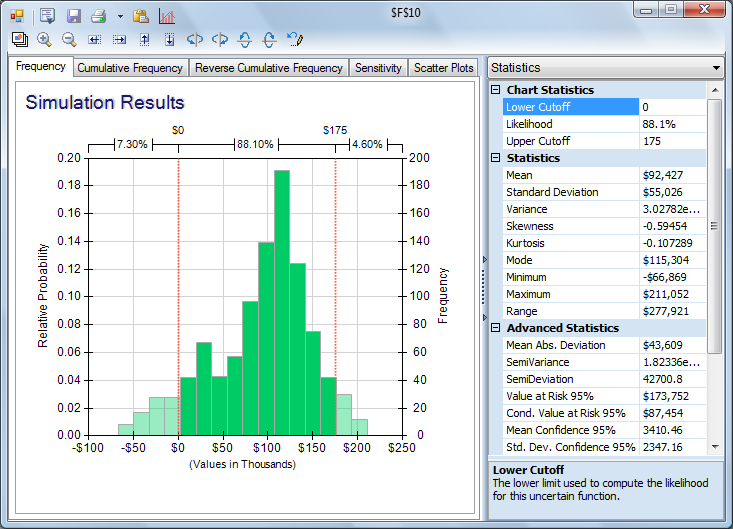
Also note that an Upper Cutoff value of 175 has been entered in the Statistics pane (above), resulting in a second red vertical line in the chart at this value. The top of the chart now indicates that 4.6% of the simulation trials produced net profit values in excess of $175,000 -- and 88.1% of the net profit values fell between $0 and $175,000.
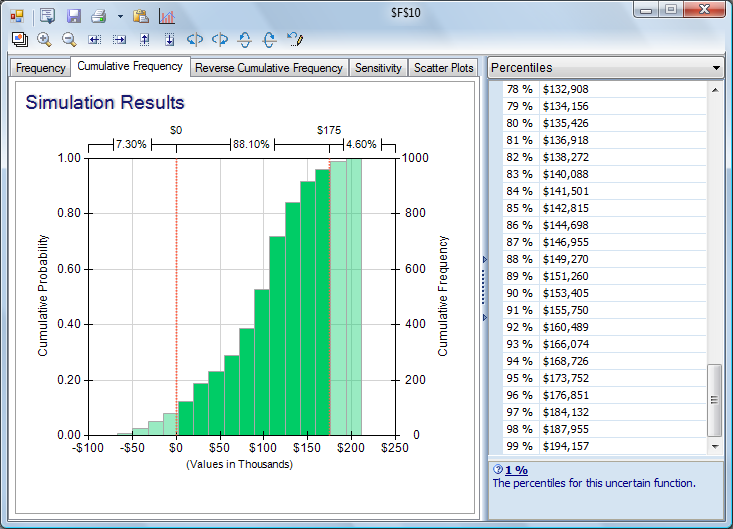
Another view of the full range of outcomes is shown on the Cumulative Frequency tab, shown below. Each bar on this tab shows the frequency with which Net Profit was less than or equal to the value on the horizontal axis. The Percentiles pane in the Uncertain Function dialog shows the same information as the Cumulative Frequency tab, but in numeric form.
We now have a pretty good idea of the full range of outcomes for Net Profit. In a conventional what-if spreadsheet model, we'd now be asking "How can we increase Net Profit?" But with a risk analysis model, we can also ask and answer questions like "How can we reduce the chance of a loss?" and "How can we reduce the variability of Net Profit?" Sensitivity analysis can help us answer all these questions, as discussed on the next page.
< Back to: Monte Carlo Simulation Tutorial StartNext: Sensitivity Analysis >