Introducing Uncertainty in a Model
To turn the spreadsheet model on the previous page into a risk analysis model, we need to replace the fixed average Sales Volume, Selling Price, and Unit Cost amounts with variable amounts that reflect their uncertainty.
Sales and Price
Since there are equal chances that the market will be Slow, OK, or Hot, we want to create an uncertain variable that selects among these three possibilities by generating a random number -- say 1, 2 or 3 -- with equal probability. We could then associate the number 1 with the "Hot Market" state, the number 2 with the "OK Market" state, and the number 3 with the "Slow Market" state. We can generate these numbers easily in Risk Solver using an integer uniform probability distribution. We'll then base the Sales Volume and Selling Price on the value of this uncertain variable.
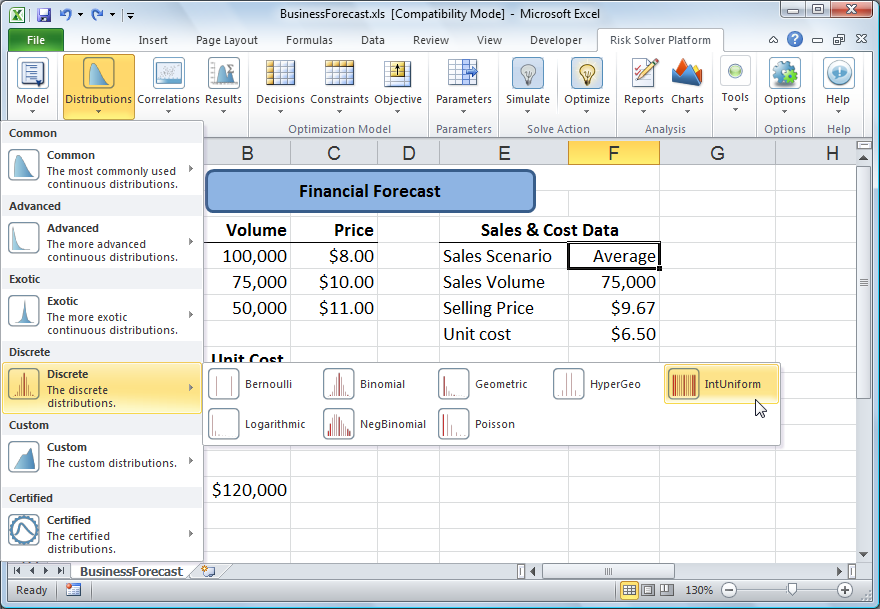
With cell F4 selected, we click the Distributions button on the Risk Solver Ribbon and then select IntUniform from the Discrete distributions gallery (as shown below).
Risk Solver displays the Uncertain Variable dialog with a chart of the integer uniform distribution -- initially with parameters: lower 0 and upper 10. We edit these parameters as shown below to read: lower 1 and upper 3. This means that on each trial, Risk Solver will randomly draw a number of 1, 2 or 3 from this distribution. Again, these numbers will represent the three different assumed market states that can occur in our problem.
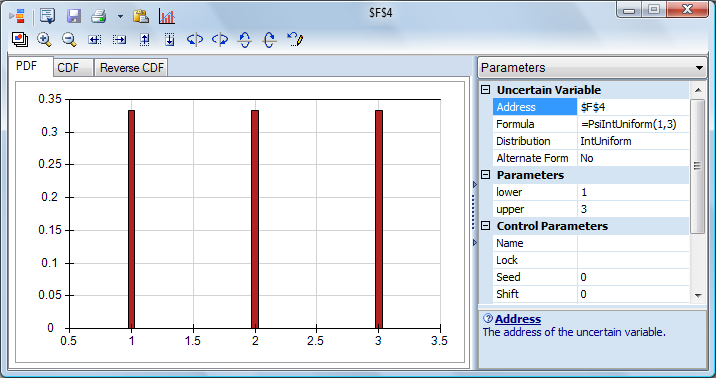
When we click the Save icon in the dialog toolbar, the formula =PsiIntUniform(1,3) is written to cell F4. F4 is now an uncertain variable. (Note that you could also type the formula =PsiIntUniform(1,3) in cell F4.) If we now repeatedly press function key [F9] to recalculate the spreadsheet several times, a different value -- either 1, 2 or 3 -- appears in cell F4 with each recalculation.
Next, we will use the values of 1, 2 or 3 in cell F4 to display the appropriate Sales Volume and Selling Price values in cells F5 and F6, respectively, associated with each market state . With cell F5 selected, we enter the formula:
Formula for cell F5 (Sales Volume): =CHOOSE(F4,B4,B5,B6)
This will cause F4 to return 100,000, 75,000, or 50,000, depending on the value in F4 (which will be 1, 2 or 3). Next, with cell F6 selected, we enter the formula:
Formula for cell F6 (Selling Price): =CHOOSE(F4,C4,C5,C6)
This will cause F6 to return $8, $10 or $11, depending on the value in F4 (again, 1, 2, or 3). Notice that the values returned by F5 and F6 are related, or correlated: Higher sales volume is accompanied by lower selling prices, and vice versa. If we allowed scenarios with 100,000 units sold at $11 each, our model would be unrealistic. Risk Solver supports more versatile ways to specify correlation between uncertain variables, but this approach is easy to understand in this example.