Solver's Rank and Percentile Tool
The Rank and Percentile tool generates an output table containing the ordinal and percentage ranking of each value in the dataset.
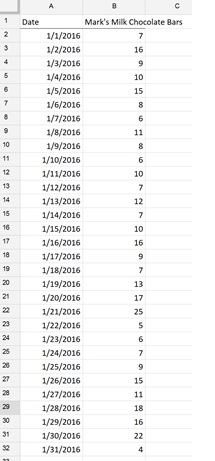
Use the Rank and Percentile tool on the example dataset below to rank the observations from largest to smallest and to generate the percentile values.

To generate the rankings
- On the XLMiner Analysis ToolPak pane, click Rank and Percentile
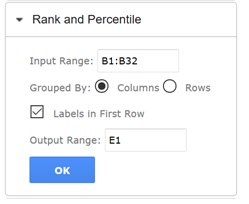
- Enter B1:B32 for Input Range.
- Leave "Columns" selected for Grouped By since the data is contained within a column.
- Since cell B1 contains the column label, leave Labels in First Row selected.
- Enter E1 for the Output Range.
- Click OK.

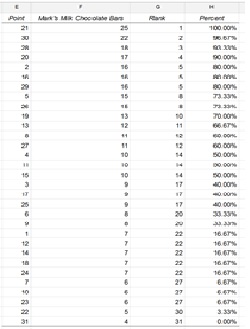
The results are shown below.

The sample values have been ordered from largest to smallest with their corresponding rankings and percentiles.
