All Psi Statistics functions used in Simulation except PsiCorrelation() and PsiFrequency() have been extended to support Dimensional Modeling. Psi Statistics functions can be entered into a single cell (i.e. a normal function) which will "spill" down.
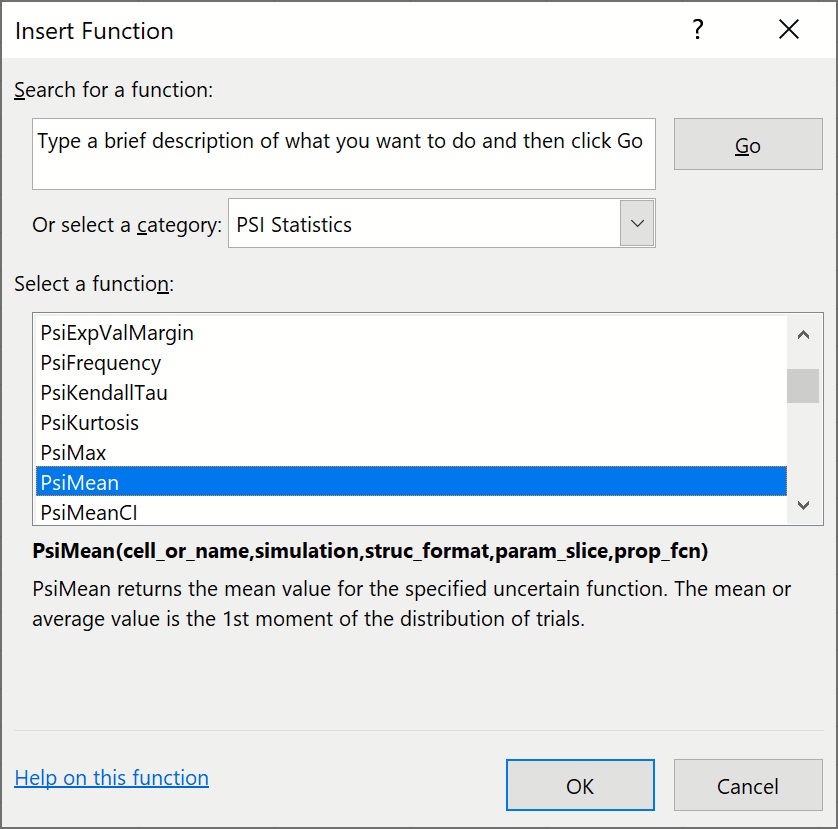
To insert a Psi Statistics function, click Formulas – Insert Function on the Excel Ribbon, select Psi Statistics from the Or select a category dropdown menu, select the desired function from the list. In this example, we’ll use PsiMean() -- select PsiMean from the list, then click OK.
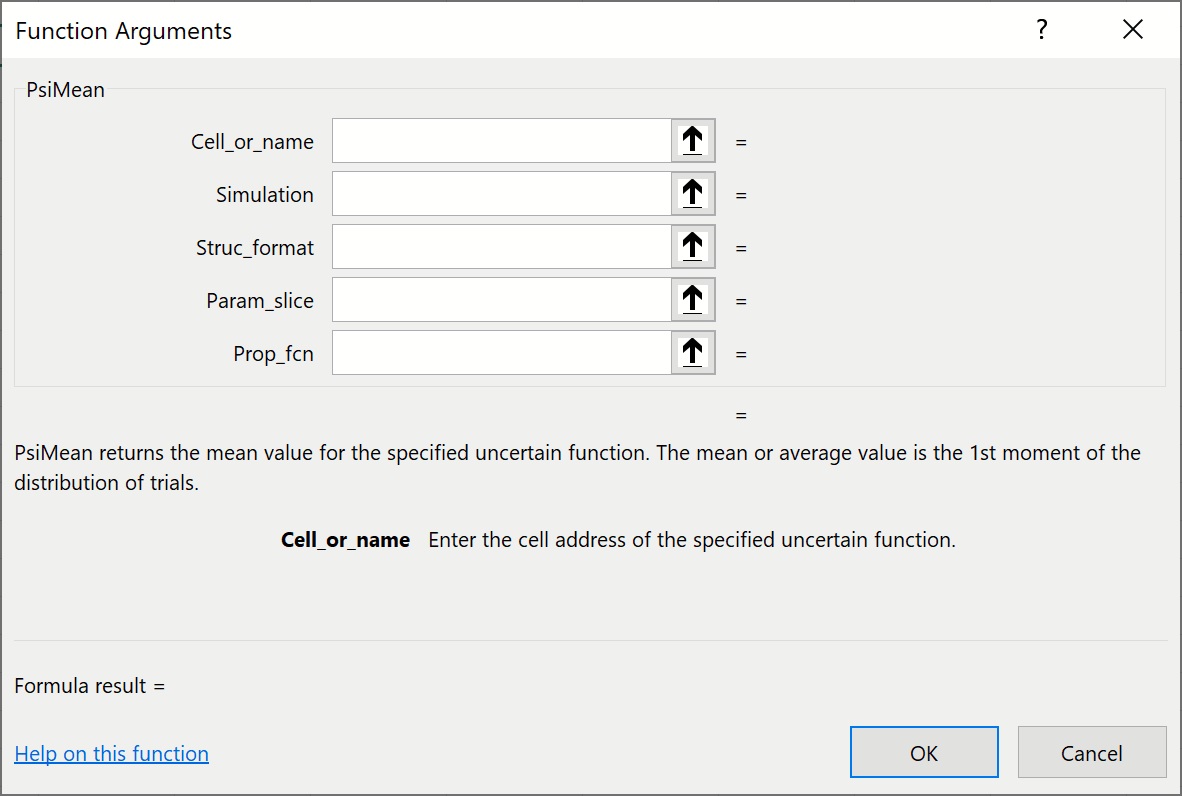
Cell_or_name: Enter an existing cube for which Psi Statistic information is desired.
Additional Arguments: Some Psi Statistics functions include additional arguments such as a Target Cell, Percentile, Confidence Level, etc. For more information on this additional arguments, see the Psi Function Reference chapter in this guide.
Optimization: This argument is optional. This argument specifies the simulation number to which the function will be applied. If omitted, the simulation selected in the Ribbon will be used.
Struc_format: This argument is an optional argument entered as a string. If omitted, all cube values will be printed in a single column. If “dims” is passed for this argument, the Psi Statistic function will print all dimensions in the cube with their lengths so the user can be advised of the size of the cubes and will be able to estimate the range needed when entering the Psi Statistic function as an array formula. If “vals” is passed for this argument, the result values will be displayed along with the dimension elements in the form of a relational or pivot table. Please see the Simulation example in the Dimensional Modeling chapter in Frontline Solvers User Guide for more information on this function.
It’s also possible to use this argument to return the name of a specific element in a cube containing one or more structural dimensions. To use this argument to return the value of a specific element in a 1-dimensional cube (containing a structural dimension), use the form: “ [StructuralDimisension1].[Element1]”.
To use this argument to return the value of a 2-dimensional cube (containing structural dimensions), use the form: “[StructuralDimension1].[Element],[StructuralDimension2].[Element]”.
To use this argument to return the value of a N-dimensional cube (containing structural dimensions), use the form: “[StructuralDimension1].[Element],[StructuralDimension2].[Element],…,[StructuralDimensionN].[Element]”.
Param_slice: The param_slice argument is an optional string argument specifying the desired element “slice” for the parametric dimensions. If omitted the elements selected in the pane will be used.
It’s also possible to use this argument to return the value of a specific element in a cube containing one or more parametric dimensions.
To use this argument to return the value of a specific element in a 1-dimensional cube (containing a parametric dimension), use the form: “[ParametricDimisension1].[Element1]”.
To use this argument to return the value of a 2-dimensional cube (containing parametric dimensions), use the form: “[ParametricDimension1].[Element],[ParametricDimension2].[Element]”.
To use this argument to return the value of a N-dimensional cube (containing parametric dimensions), use the form: “[ParametricDimension1].[Element],[ParametricDimension2].[Element],…,[ParametricDimensionN].[Element]”.
Function Signatures
One signature is provided for this function.
=PsiXxx(output_cell, [simulation], [struc_format], [param_slice])
where Xxx is any Psi statistics function except PsiCorrelation and PsiFrequency.
output_cell: (required) A cell reference containing an uncertain function.
Simulation: (optional) An argument specifying the simulation number related to PsiSimParam() to which the function will be applied. If omitted, the simulation selected in the Ribbon will be used.
struc_format: (optional) An optional argument entered as a string. If omitted, all cube values are printed in a single vector.
If PsiCubeData is entered as an array (with size equal to the number of dimensions in the Function_cell cube) and struc_format = “dims”, PsiCubeData() prints all dimensions in the cube with their lengths.
Once the size of the cube is obtained or if the cube dimensions are already known, enter this function as an array (with size equal to the number of dimensions by number of cube elements in the Function_cell cube) while passing struc_format = “vals” to print all cube elements in the form of a relational or pivot table. In addition, this argument can also be used to selectively print only a portion of a cube’s elements or a “slice” of the data table. (See below for an example.)
param_slice: Argument specifying the desired element “slice” for parametric dimensions. If omitted, the elements selected for the Dimension’s Current Value in the Solver Task Pane will be used.
To use this argument to return the value of a specific element in a 1-dimensional cube (containing a parametric dimension), use the form: “[ParametricDimisension1].[Element1]”.
To use this argument to return the value of a 2-dimensional cube (containing parametric dimensions), use the form: “[ParametricDimension1].[Element],[ParametricDimension2].[Element]”.
To use this argument to return the value of a N-dimensional cube (containing parametric dimensions), use the form: “[ParametricDimension1].[Element],[ParametricDimension2].[Element],…,[ParametricDimensionN].[Element]”.
Examples
=PsiMean(A1, 1, ”dims”) – When entered as an array with size equal to the number of dimensions included in the A1 cube for the 1st optimization, the dimension name and number of elements will be returned.
=PsiMean(A1, 2, “vals”) – When entered as an array with size equal to the number of dimensions included in the A1 cube, the values of the fact table for the 2nd optimization will be displayed along with the dimension elements in the form of a relational or pivot table. (Simulations to run must be set to 2 or larger in the Platform tab of the Solver task pane.)
=PsiMean(A1, 4, ”[Parts].[Chassis], [Products].[TV]”) - When entered as an array of size 3, the cube elements as well as the element value will be displayed for the 4th optimization. (Simulations to run must be set to 4 or larger in the Platform tab of the Solver task pane.)
Cells containing Psi Statistics functions will appear under Simulation Statistic Functions in the Model tab of the Solver task pane. Expand the range H6:I9 to display the following.

Address: Displays the cell address range where the Psi Statistic is located (read – only).
Formula: Displays the array formula located in the Address range (read – only).
Select the F9 cube (under H6:I9) to display the following statistics.

Address: Displays the cell address range where the Cube referenced in the PsiStatistic located in cells H6:I9 is located (read – only).
Formula: Displays the formula for the cube located in cell F9 (read – only).
Statistics: Simulation results for the first element in the cube located in cell F9. For a description of the statistic, click the name of the statistic at the bottom of the task pane.