The following options appear on the four Multiple Linear Regression dialogs.
Linear Regression Dialog, Data tab
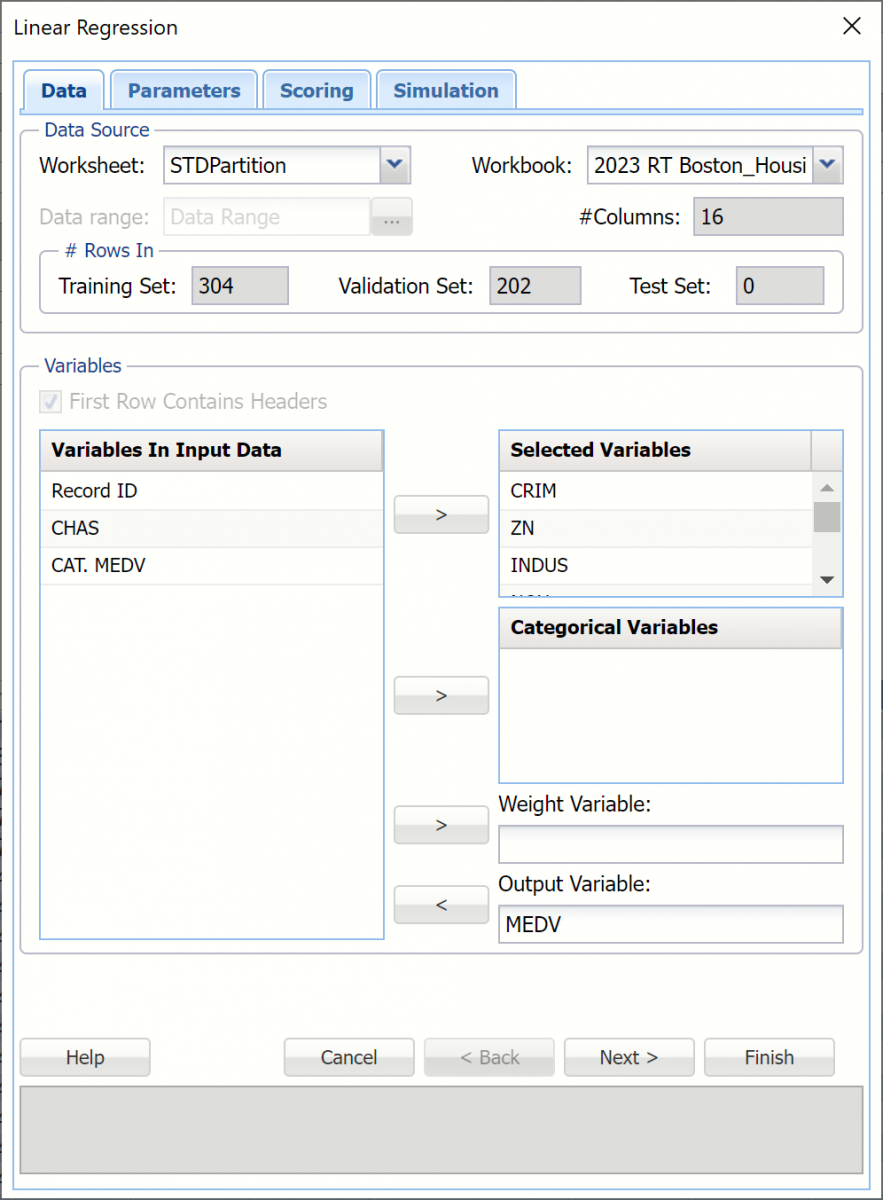 Variables In Input Data
All variables in the data set are listed here.
Selected Variables
Variables listed here will be utilized in the output.
Categorical Variables
Place categorical variables from the Variables listbox to be included in the model by clicking the > command button. This classification algorithm will accept both numeric and non-numeric categorical variables.
Weight Variable
One major assumption of Multiple Linear Regression is that each observation provides equal information. Analytic Solver Data Science offers an opportunity to provide a Weight Variable, which allocates a weight to each record. A record with a large weight influences the model more than a record with a smaller weight.
Output Variable
Select the variable whose outcome is to be predicted here.
Linear Regression Dialog, Parameters tab
See below, for option explanations included on the Linear Regression Parameters dialog.
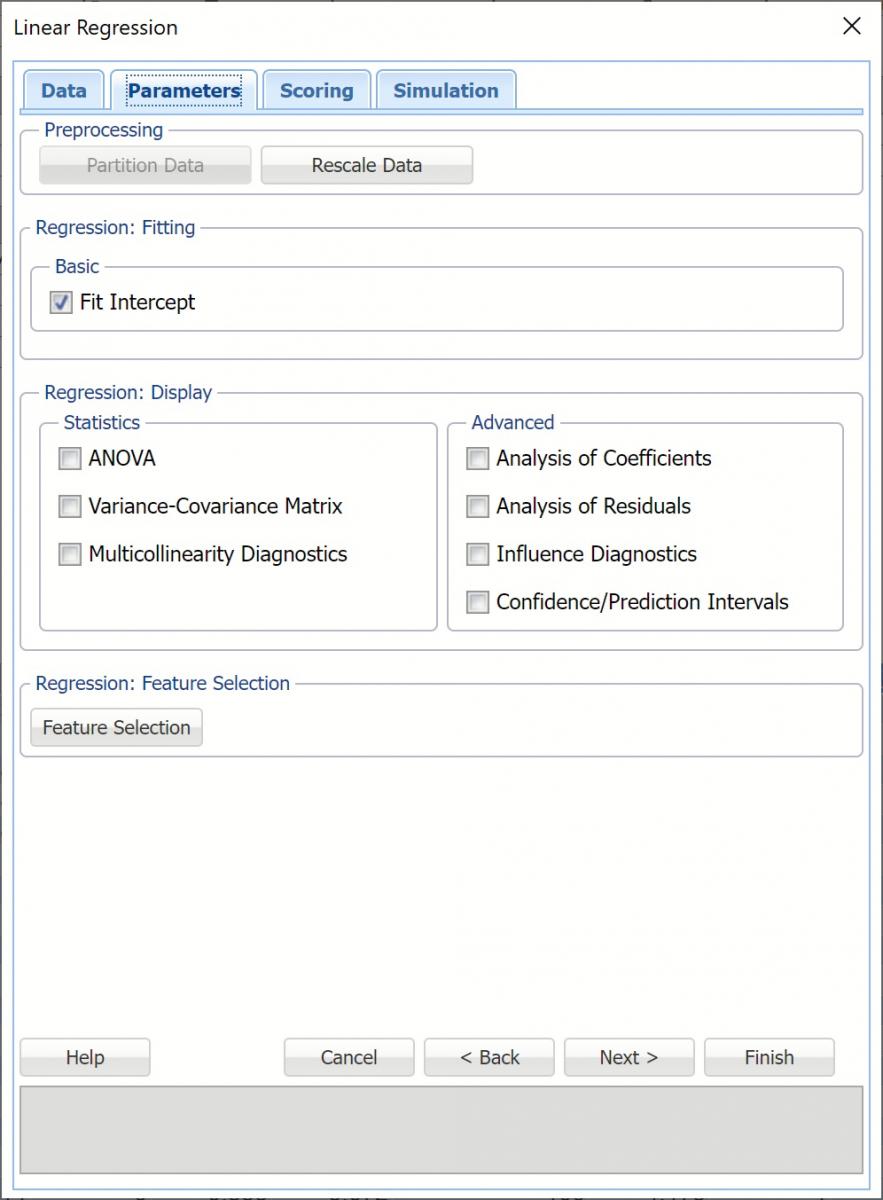 Partition Options
Analytic Solver Data Science includes the ability to partition a dataset from within a classification or prediction method by clicking Partition Data on the Parameters dialog. Analytic Solver Data Science will partition your dataset (according to the partition options you set) immediately before running the prediction method. If partitioning has already occurred on the dataset, this option will be disabled. For more information on partitioning, please see the Data Science Partitioning chapter.
Rescale Data
Click Rescale Data to normalize one or more features in your data during the data preprocessing stage. Analytic Solver Data Science provides the following methods for feature scaling: Standardization, Normalization, Adjusted Normalization and Unit Norm. For more information on this new feature, see the Rescale Continuous Data section within the Transform Continuous Data chapter that occurs earlier in this guide.
Fit Intercept
When this option is selected, the default setting, Analytic Solver Data Science will fit the Linear Regression intercept. If this option is not selected, Analytic Solver will force the intercept term to 0.
Feature Selection
When you have a large number of predictors and you would like to limit the model to only the significant variables, click Feature Selection to open the Feature Selection dialog and select Perform Feature Selection at the top of the dialog.
Maximum Subset Size can take on values of 1 up to N where N is the number of Selected Variables. If no Categorical Variables exist, the default for this option is N. If one or more Categorical Variables exist, the default is "15".
Analytic Solver Data Science offers five different selection procedures for selecting the best subset of variables.
- Backward Elimination in which variables are eliminated one at a time, starting with the least significant. If this procedure is selected, FOUT is enabled. A statistic is calculated when variables are eliminated. For a variable to leave the regression, the statistic's value must be less than the value of FOUT (default = 2.71).
- Forward Selection in which variables are added one at a time, starting with the most significant. If this procedure is selected, FIN is enabled. On each iteration of the Forward Selection procedure, each variable is examined for the eligibility to enter the model. The significance of variables is measured as a partial F-statistic. Given a model at a current iteration, we perform an F Test, testing the null hypothesis stating that the regression coefficient would be zero if added to the existing set if variables and an alternative hypothesis stating otherwise. Each variable is examined to find the one with the largest partial F-Statistic. The decision rule for adding this variable into a model is: Reject the null hypothesis if the F-Statistic for this variable exceeds the critical value chosen as a threshold for the F Test (FIN value), or Accept the null hypothesis if the F-Statistic for this variable is less than a threshold. If the null hypothesis is rejected, the variable is added to the model and selection continues in the same fashion, otherwise the procedure is terminated.
- Sequential Replacement in which variables are sequentially replaced and replacements that improve performance are retained.
- Stepwise selection is similar to Forward selection except that at each stage, Analytic Solver Data Science considers dropping variables that are not statistically significant. When this procedure is selected, the Stepwise selection options FIN and FOUT are enabled. In the stepwise selection procedure a statistic is calculated when variables are added or eliminated. For a variable to come into the regression, the statistic's value must be greater than the value for FIN (default = 3.84). For a variable to leave the regression, the statistic's value must be less than the value of FOUT (default = 2.71). The value for FIN must be greater than the value for FOUT.
- Best Subsets where searches of all combinations of variables are performed to observe which combination has the best fit. (This option can become quite time consuming depending on the number of input variables.) If this procedure is selected, Number of best subsets is enabled.
Regression Display
Under Regression: Display, select all desired display options to include each in the output.
Under Statistics, the following display options are present.
- ANOVA
- Variance-Covariance Matrix
- Multicollinearity Diagnostics
Under Advanced, the following display options are present.
- Analysis of Coefficients
- Analysis of Residuals*
- Influence Diagnostics
- Confidence/Prediction Intervals
*Standardized residuals are obtained by dividing the unstandardized residuals by the respective standard deviations. Unstandardized residuals are computed by the formula: Unstandardized residual = Actual response - Predicted response.
Linear Regression Dialog, Scoring tab
See below, for option explanations included on the Linear Regression Scoring dialog.
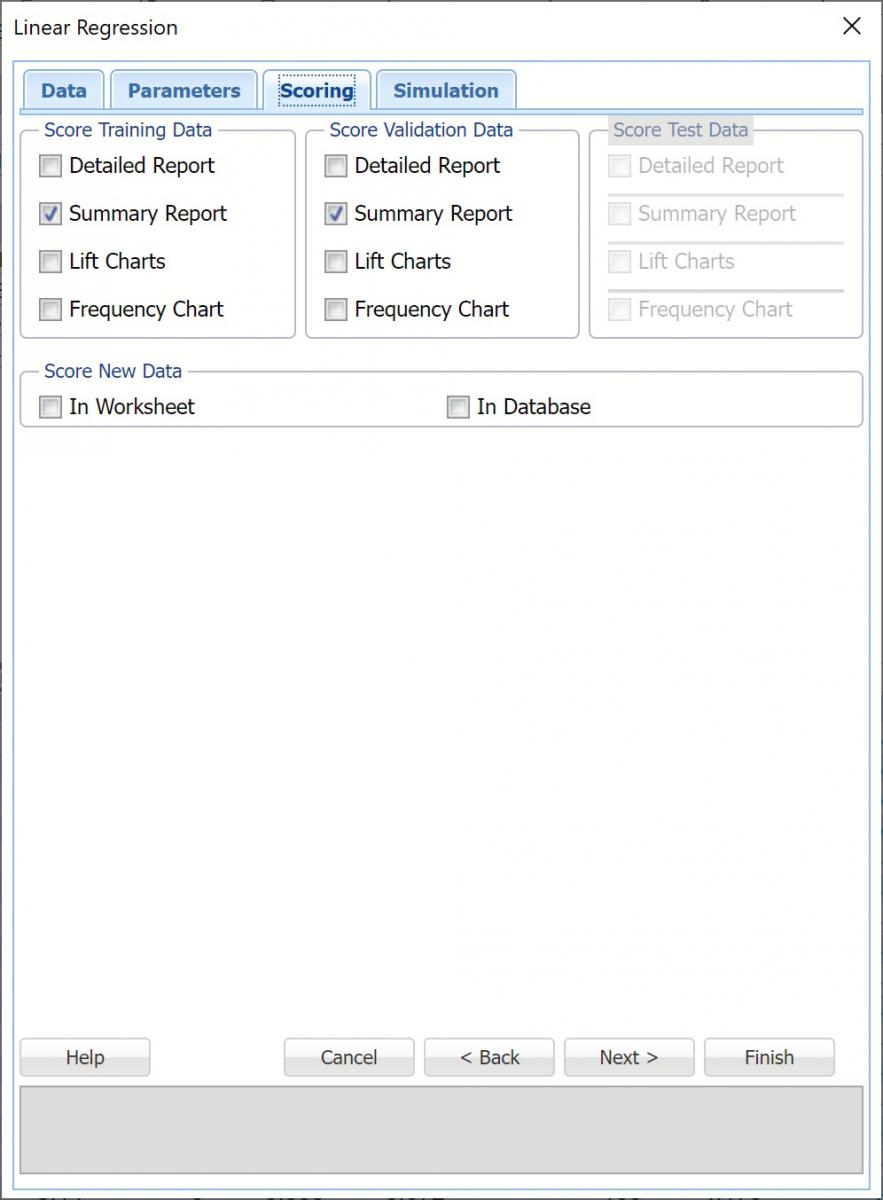 Score Training Data
Select these options to show an assessment of the performance of the Linear Regression algorithm in predicting the value of the output variable in the training data. The report is displayed according to your specifications - Detailed, Summary, and Lift charts.
New in V2023: When Frequency Chart is selected, a frequency chart will be displayed when the LinReg_TrainingScore worksheet is selected. This chart will display an interactive application similar to the Analyze Data feature, explained in detail in the Analyze Data chapter that appears earlier in this guide. This chart will include frequency distributions of the actual and predicted responses individually, or side-by-side, depending on the user's preference, as well as basic and advanced statistics for variables, percentiles, six sigma indices.
Score Validation Data
These options are enabled when a validation data set is present. Select these options to show an assessment of the performance of the Linear Regression algorithm in predicting the value for the output variable in the validation data. The report is displayed according to your specifications - Detailed, Summary, and Lift charts. When Frequency Chart is selected, a frequency chart (described above) will be displayed when the LinReg_ValidationScore worksheet is selected.
Score Test Data
These options are enabled when a test set is present. Select these options to show an assessment of the performance of the Linear Regression algorithm in predicting the value of the output variable in the test partition. The report is displayed according to your specifications - Detailed, Summary, and Lift charts. When Frequency Chart is selected, a frequency chart (described above) will be displayed when the LinReg_TestScore worksheet is selected.
Score New Data
These options are enabled when a test set is present. Select these options to show an assessment of the performance of the Linear Regression algorithm in classifying the test data. The report is displayed according to your specifications - Detailed, Summary, and Lift charts. When Frequency Chart is selected, a frequency chart (described above) will be displayed when the LinReg_TestScore worksheet is selected.
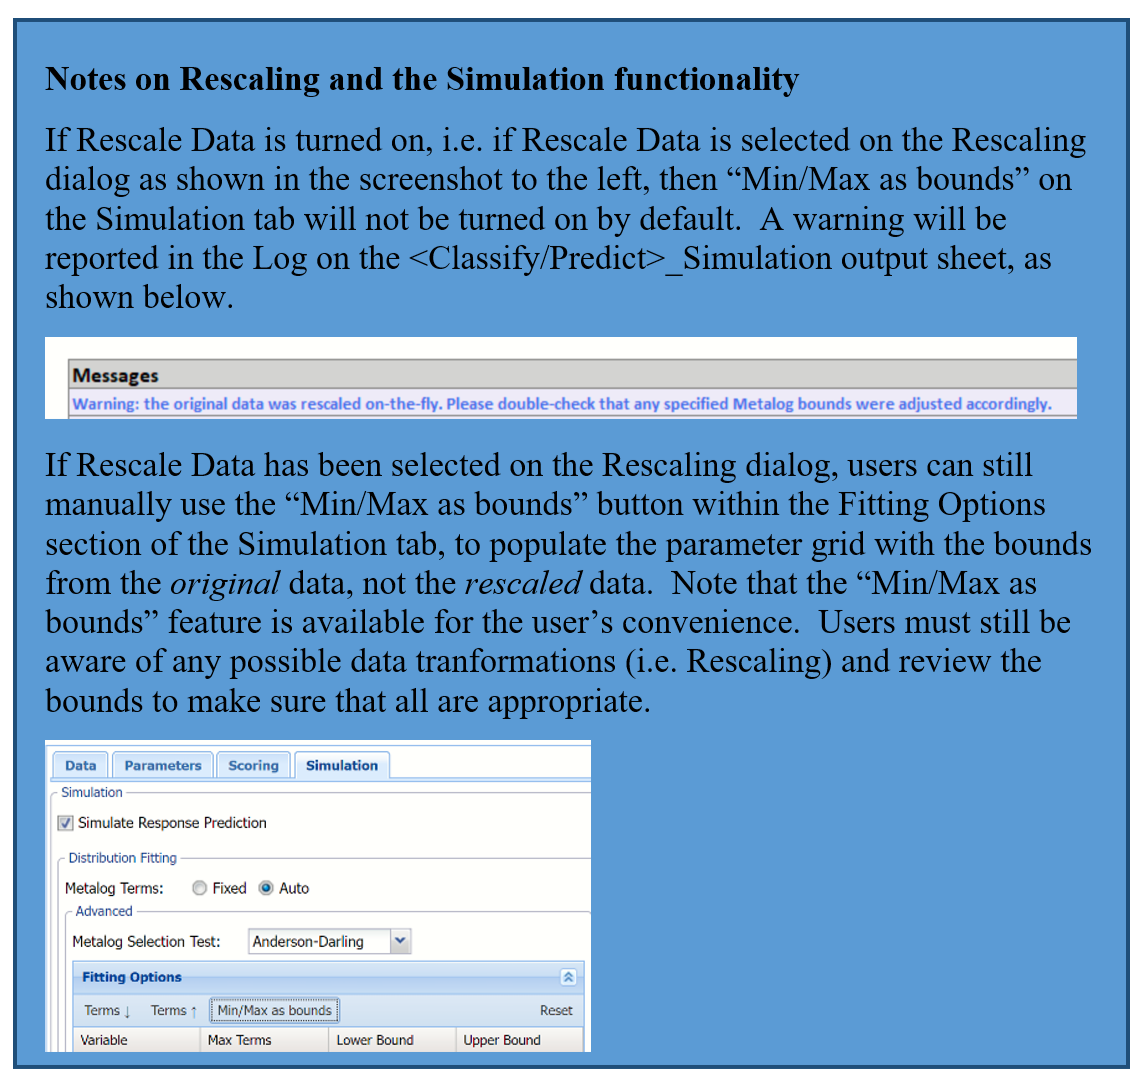
Linear Regression Dialog, Simulation tab
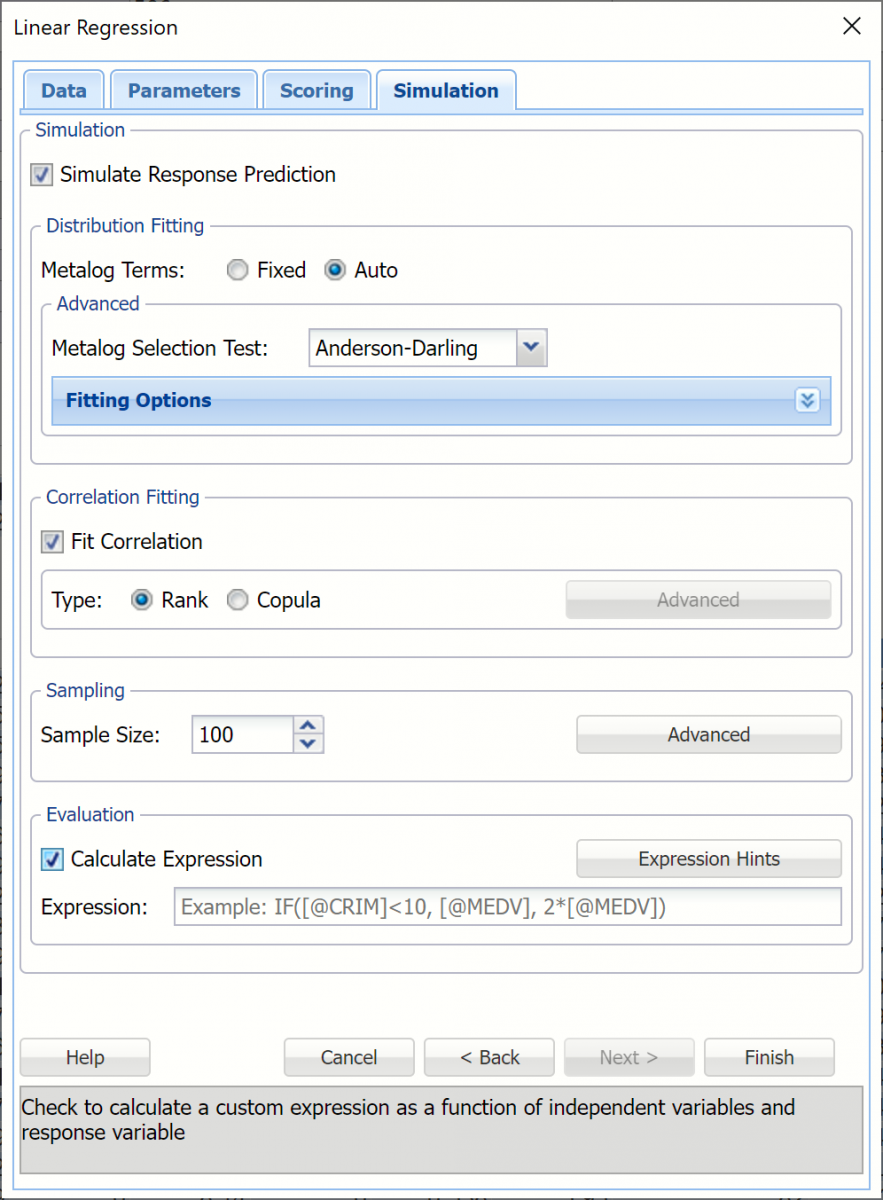 All supervised algorithms in V2023 include a new Simulation tab. This tab uses the functionality from the Generate Data feature (described in an earlier topic) to generate synthetic data based on the training partition, and uses the fitted model to produce predictions for the synthetic data. The resulting report, LinReg_Simulation, will contain the synthetic data, the predicted values and the Excel-calculated Expression column, if present. In addition, frequency charts containing the Predicted, Training, and Expression (if present) sources or a combination of any pair may be viewed, if the charts are of the same type.
Evaluation: Select Calculate Expression to amend an Expression column onto the frequency chart displayed on the LinReg_Simulation output tab. Expression can be any valid Excel formula that references a variable and the response as [@COLUMN_NAME]. Click the <I>Expression Hints </I>button for more information on entering an expression.