In this section, we're going in a somewhat different direction from the Hortonworks study of the Airline dataset. For example, HortonWorks created a new variable to measure how close a flight departure is to a major holiday, guessing that this variable would have explanatory power -- but we won't do this. Instead, we want to explore computer-assisted Feature Selection: We'll ask “Are all these features really important? Which ones provide useful information about the possible delay of a flight?”
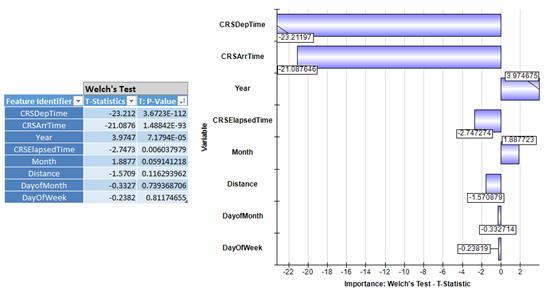
We can get a helpful hint from the Chi-squared statistics for the regression coefficients and the corresponding significance levels (p-values) in our first model, which might lead us to exclude some predictors from the model. But Analytic Solver Data Mining has an easy-to-use tool, available via a menu option Explore - Feature Selection, that can apply a variety of tests to continuous and categorical variables, for both classification and prediction tasks, so we'll illustrate its use here. Below is the report and chart resulting from a univariate Welch’s test (a modified Student’s t-test) for each predictor included in our earlier Logistic Regression model, against the binary response variable we created earlier (DepDelay_Binary is 1 if a flight is delayed 15 minutes or more):

Before any further analysis, we can immediately see pretty clear evidence that the scheduled departure and scheduled arrival times have the strongest correspondence with departure delays, according to Welch’s test. Intuitively, this may be explained by the fact that flight delays occur more often later in the day.
Just as the authors of Hortonworks study found, we see graphic evidence that flight delays pile up throughout the day, making flights scheduled late in the day more susceptible to delays. This is the sort of chart you wish you had created at the beginning of the effort, once you think of it later. Simple Feature Selection analysis often leads to this kind of insight.
A Univariate Logistic Regression Model
Our Feature Selection analysis suggests that we should try a VERY simple model: train a binary classifier based on just the Departure Time variable. Below are the results from Analytic Solver Data Mining:

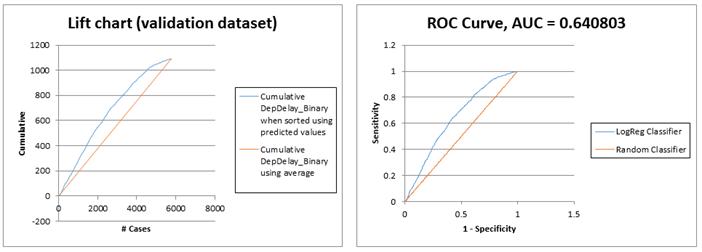
And here are the Lift Chart and ROC Curve for this one-variable model:

As frequent airline travelers can attest from anecdotal experience, time of day really matters. The performance of a simple Logistic Regression with one variable is almost identical to the 8-variable model we constructed initially:
- 8 variables model - Recall=0.64, Accuracy=59%
- 1 variable model - Recall=0.63, Accuracy=59%
Wrap-Up and Possible Further Steps
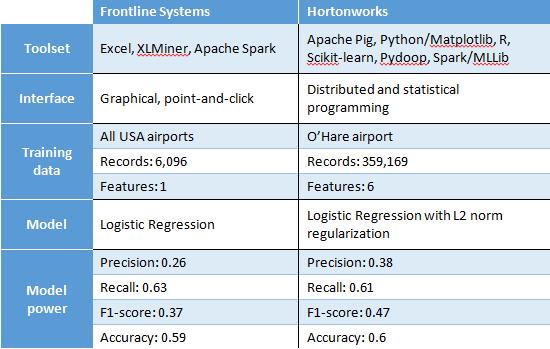
We trust we've demonstrated that it's not only possible, it's easy to work with Big Data in Excel, and to apply the same kind of predictive analytics methods available to data scientists programming in R, Python or other languages. Let's see how our basic models compare to the HortonWorks case study:

It's worth mentioning that, where Hortonworks sought to simplify the analysis in their case study by selecting flights from O’Hare airport only -- a common approach when first analyzing Big Data -- we used a statistically representative sample of all the data, from all US airports in this study. While the approach taken always depends on one's objectives, we believe the sampling approach has a lot to recommend it.
We're far from finished, of course, in either the HortonWorks study or this one. Some possible directions for further analysis include:
- Create further data visualizations to get deeper insights about the relationships hidden in the data
- Enrich the model by factorizing/encoding other relevant categorical features available in the dataset
- Enrich the model by including other data that may be helpful for predicting airline delays. As suggested by Hortonworks, one may include weather data provided by NOAA, and data about how close flights are to major US holidays.
- Use multivariate wrapper/embedded Feature Selection approaches such as Stepwise Regression to identify the best-performing subset of features.
- Build and evaluate more complex nonlinear models such as Classification Trees, Neural Networks, or ensembles of these "weak learners".
All of these steps and more could be performed easily in Analytic Solver Data Mining. We hope some readers will actually take this case study further!
