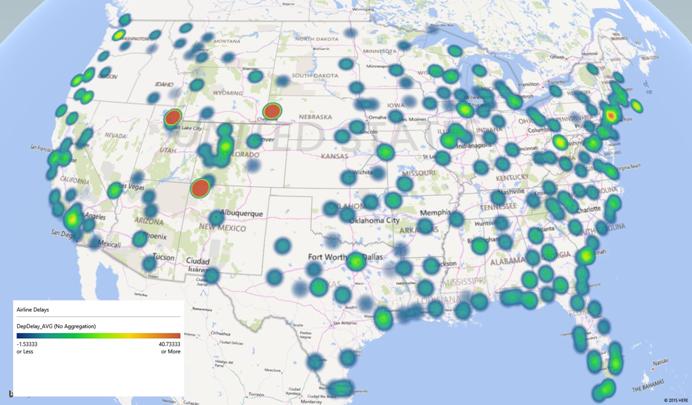
Can you work with Big Data in Excel? From the barrage of recent news, white papers, and sales calls about Big Data, you would think not. A common theme is that “spreadsheets can’t handle Big Data and advanced analytics,” and that companies need to “move up” to new tools, that the vendors with the white papers offer -- implicitly, the benefits outweigh the expense and steep learning curve. But in this blog post, we'll show that you can work with Big Data in Excel (with help from our Apache Spark link), without a lot of expense or a steep learning curve.
To do this, we'll study the same airline Big Data dataset used by Cloudera, formerly HortonWorks, one of the best-known Big Data firms, in an excellent series of tutorial blog posts. We'll answer the same kinds of questions, and build a similar predictive model to the one built by Cloudera data scientists. But we'll do all of this "point and click", without any programming, in desktop Excel with Analytic Solver Data Mining, our powerful Excel add-in -- and one other tool, Microsoft's free Power Map tool, to produce the image below.

20+ Years of Airline Data
The public dataset used in this example consists of flight arrival and departure information for all commercial flights within the USA dating from October 1987 to April 2008, obtained from the Research and Innovative Technology Administration (RITA) which coordinates the U.S. Department of Transportation research programs. The data was obtained from 29 commercial airlines and 3,376 airports, and consists of nearly 120 million records (12 GB storage uncompressed), including 3.2 million canceled flights and 25 million flights at least 15 minutes late. The US airline industry generates about $157 billion in annual revenue, so it’s no wonder that both travelers and airlines incur great costs when nearly 20% of flights are delayed or canceled.
Goals of This Tutorial
We won’t aim to replicate each step of the case study presented by Cloudera, nor will we aim to show all the advanced machine learning methods available in Analytic Solver Data Mining. Instead, we'll show how quickly a business analyst with Excel and Analytic Solver can get essentially the same results as a team of data scientists and programmers equipped with the full set of Big Data tools, programming languages and statistical packages (Hadoop, Pig, Python, Pandas, NumPy, MatPlotLib and SciKit-Learn) -- in a matter of minutes, not hours or days. We'll walk through these steps:
- Drawing a representative data sample from an Apache Spark Big Data cluster into Excel
- Summarizing and visualizing the airline data for immediate insights about flight delays
- Preprocessing raw data to exclude canceled and diverted flights
- Building a Logistic Regression model for predicting flight delays
- Using Feature Selection to identify the important flight attributes for predicting delays
- Exploring the effects of eliminating redundant features from the model
Parts of this example are covered in our Analytic Solver Data Mining Online Help. You can follow the case study on your own PC if you have Analytic Solver installed, or if you are using the Analytic Solver Cloud app within Desktop or Online Excel, you can download a free trial here.
One take-away from this blog post is that a statistically representative sample can be "just as good" as the full dataset for many kinds of analysis. This is hardly a new idea -- statisticians and practitioners have applied sampling methods to great effect for many years -- but it seems to have been lost in the hype over Big Data.
