Random Trees Ensemble Method Example
To further emulate the results of the journal article discussed in the Feature Selection Example, the Random Trees Ensemble Classification Methods will be used to investigate if a machine learning algorithm can predict a patient's survival using the top two or three ranked features as found by the Feature Selection tool.
Inputs
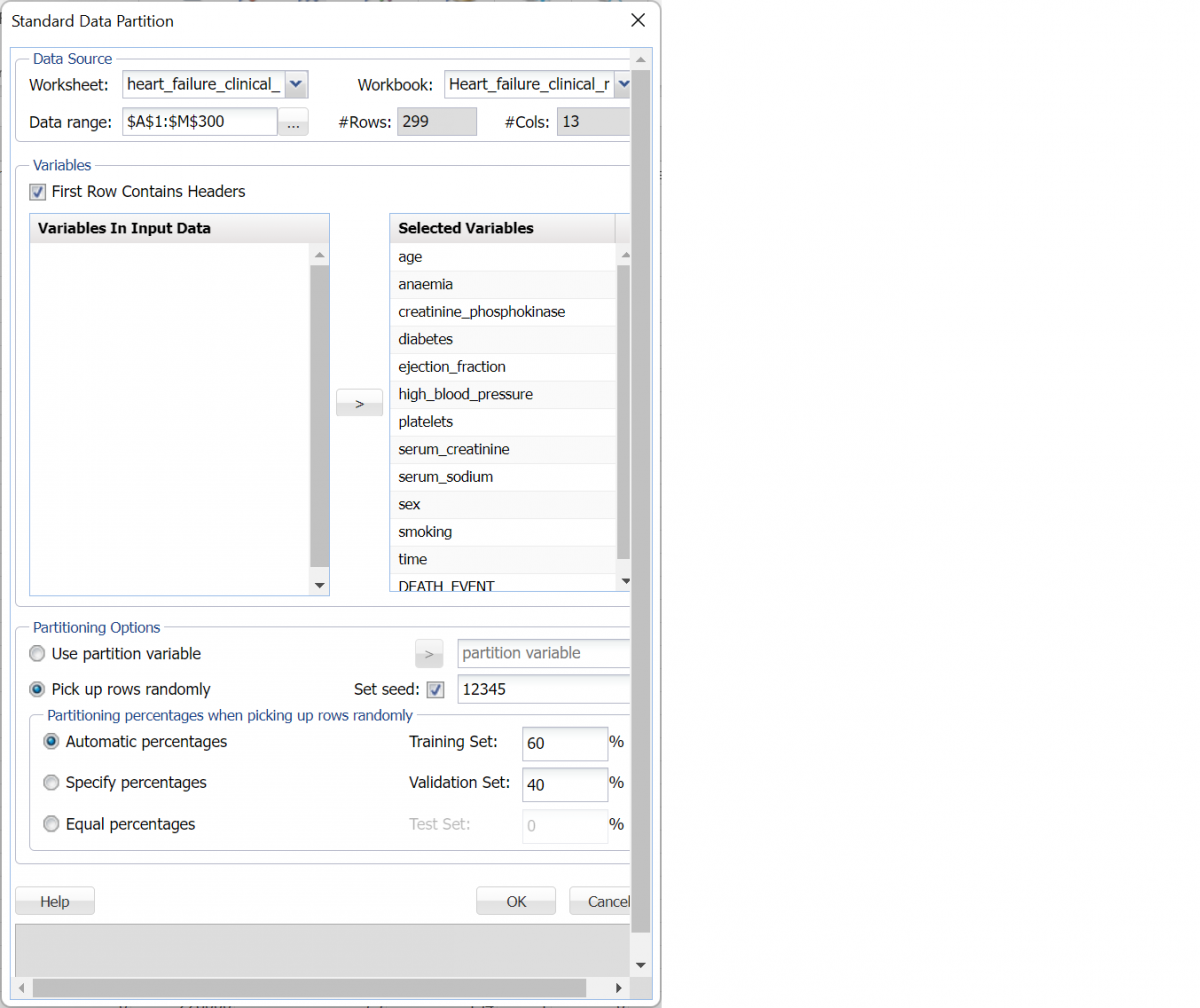
First, click Partition – Standard Partition to partition the dataset into Training, Validation and Test Sets using the default percentages of 60% allocated to the Training Set and 40% allocate to the Validation Set.
Standard Data Partition dialog
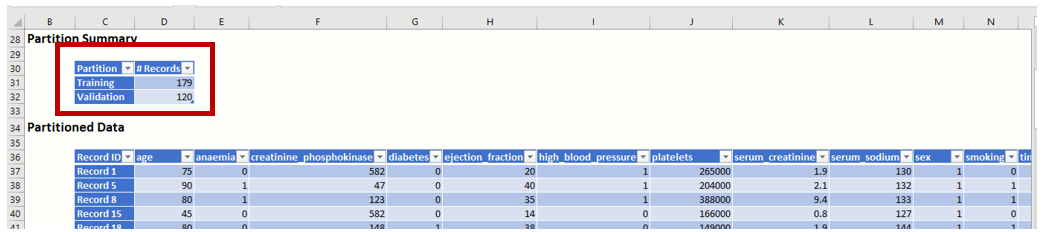
Then click OK to create the two partitions. A new worksheet STDPartition is inserted to the right of the dataset. The number of records allocated to the Training partition is 179 and the number of records allocated to the Validation partition is 120.
Standard Data Partitioning results
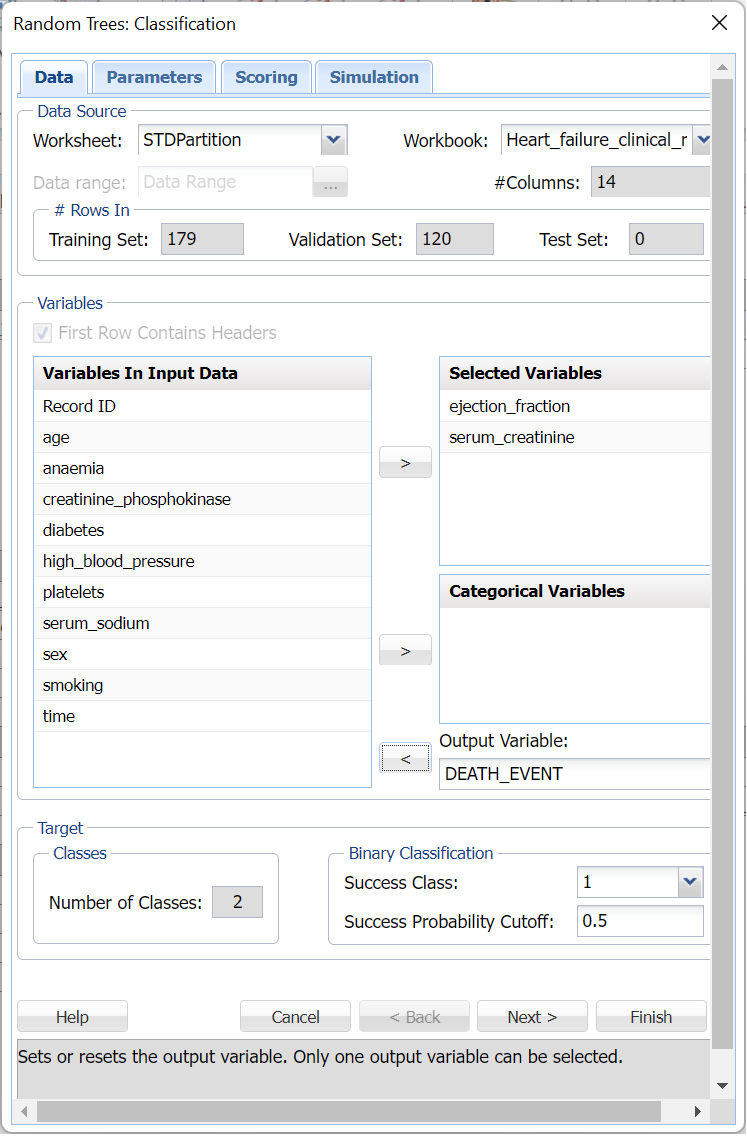
The first time that the model is fit, only two features (ejection_fraction and serum_creatinine) will be utilized.
With the StdPartition workbook selected, Click Classify – Ensemble – Random Trees to open the Random Trees: Classification dialog.
Select the two Variables from Variables In Input Data (ejection_fraction and serum_creatinine) and click the right pointing arrow to the left of Selected Variables to add these two variables to the model. Then take similar steps to select DEATH_EVENT as the Output Variable.
Leave Success Class as "1" and Success Probability Cutoff at 0.5 under Binary Classification.
The Random Trees: Classification dialog should be similar to the one pictured in the Figure 13 below.
Random Trees: Classification dialog with Selection Variables (serum_creatinine and ejection_fraction) and Output Variables (DEATH_EVENT) selected.
Click the Scoring tab to advance to the Random Trees: Classification Scoring dialog.
For more information on Random Trees parameters, see the Random Trees Classification Options section below.
Summary Report is selected by default. Select Detailed Report for both Score Training Data and Score Validation Data and then click Finish.
Random Trees: Classification dialog with output choices selected

Click Next to advance to the Simulation tab.
Select Simulation Response Prediction to enable all options on the Simulation tab of the Random Trees Classification dialog.
Simulation tab: All supervised algorithms include a new Simulation tab. This tab uses the functionality from the Generate Data feature (described earlier in this guide) to generate synthetic data based on the training partition, and uses the fitted model to produce predictions for the synthetic data. The resulting report, CRandTrees_Simulation, will contain the synthetic data, the predicted values and the Excel-calculated Expression column, if present. In addition, frequency charts containing the Predicted, Training, and Expression (if present) sources or a combination of any pair may be viewed, if the charts are of the same type.
Random Trees Classification dialog, Simulation tab
Evaluation: Select Calculate Expression to amend an Expression column onto the frequency chart displayed on the CRandTrees_Simulation output tab. Expression can be any valid Excel formula that references a variable and the response as [@COLUMN_NAME]. Click the Expression Hints button for more information on entering an expression.
For the purposes of this example, leave all options at their defaults in the Distribution Fitting, Correlation Fitting and Sampling sections of the dialog. For Expression, enter the following formula to display if the patient sufferered catastrophic heart failure (@DEATH_EVENT) when his/her Ejection_Fraction was less than or equal to 20.
IF([@ejection_fraction]<=20, [@DEATH_EVENT], “EF>20”)
Note that variable names are case sensitive.
For more information on the remaining options shown on this dialog in the Distribution Fitting, Correlation Fitting and Sampling sections, see the Generate Data chapter that appears earlier in this guide.
Click Finish to run Random Trees Classification on the example dataset.
Outputs
Five worksheets are inserted to the right of the STDPartition tab: CRandTrees_Output, CRandTrees_TrainingScore, CRandTrees_ValidationScore, CRandTrees_Simulation and CRandTrees_Stored.
- CRandTrees_Output reports the input data, output data, and parameter settings.
- CRandTrees_TrainingScore reports the confusion matrix, calculated metrics and the actual classification by row for the training partition.
- CRandTrees_ValidationScore reports the confusion matrix, calculated metrics and the actual classification by row for the validation partition.
- CRandTrees_Simulation contains the automated risk analysis simulation results.
- CRandTrees_Stored contains the stored model which can be used to apply the fitted model to new data. See the Scoring chapter within the Analytic Solver Data Science User Guide for an example of scoring new data using the stored model.
CRandTrees_TrainingScore
Click CRandTrees_TrainingScore to view the Classification Summary and then new output variable frequency chart for the Training partition.
Since Frequency Chart was selected on the Scoring tab of the Random Trees dialog, a frequency chart is displayed upon opening of the worksheet.
Click Prediction in the upper right of the dialog, and select Prediction and Actual checkboxes to display frequency information between the Actual (Training) partition and the predicted values (Prediction). This chart quickly displays the Frequency of records labeled as 0 (survivors) and 1 (patients who succumbed to the complications of heart disease). Click the down arrow next to Frequency to view the Relative Frequency chart.
Training: Classification Summary
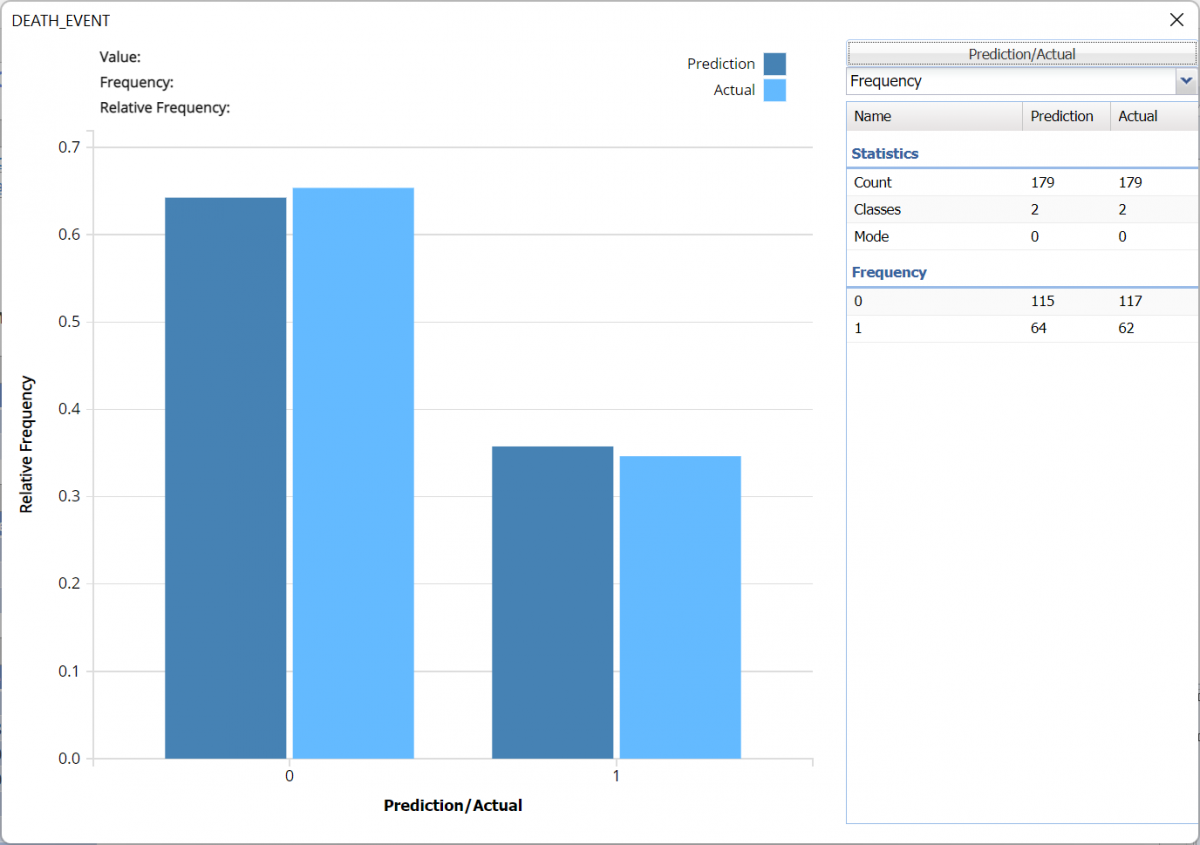
Training: Classification Summary
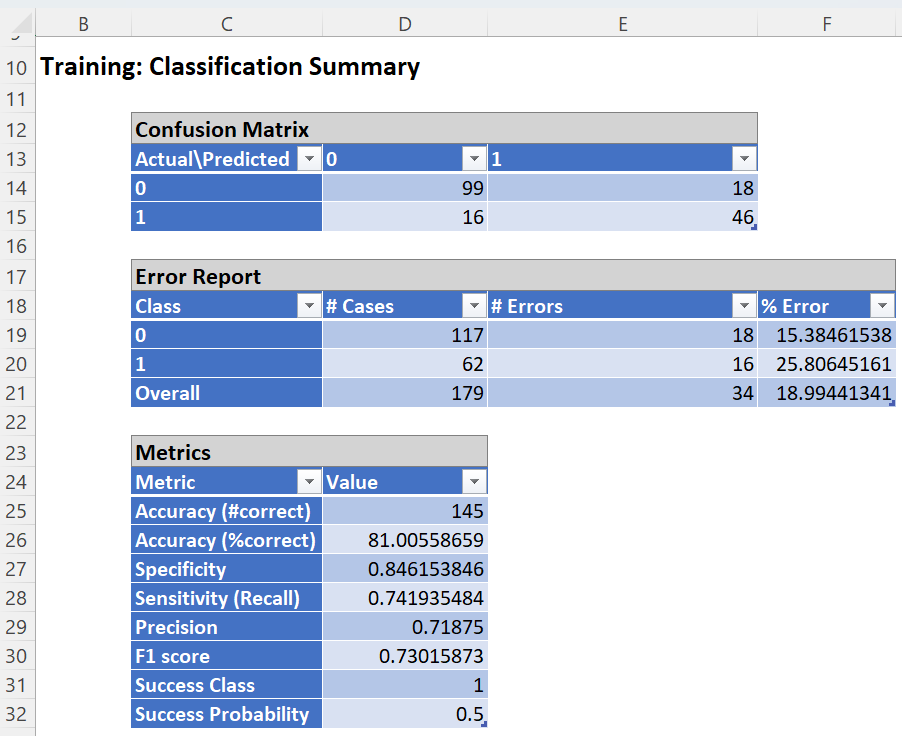
The overall error for the training partition was 17.32 with 14 surviving patients reported as deceased and 17 deceased patients reported as survivors.
Accuracy: 81.05% -- Accuracy refers to the ability of the classifier to predict a class label correctly.
Specificity: 0.846 – (True Negative)/(True Negative + False Positives)
- Specificity is defined as the proportion of negative classifications that were actually negative, or the fraction of survivors that actually survived. In this model, 99 actual surviving patients were classified correctly as survivors. There were 18 false positives or 18 actual survivors classified incorrectly as deceased.
Sensitivity or Recall: 0.742 – (True Positive)/(True Positive + False Negative)
- Sensitivity is defined as the proportion of positive cases there were classified correctly as positive, or the proportion of actually deceased patients there were classified as deceased. In this model, 46 actual deceased patients were correctly classified as deceased. There were 16 false negatives or 16 actual deceased patients were incorrectly classified as survivors.
- Note: Since the object of this model is to correctly classify which patients will succumb to heart failure, this is an important statistic as it is very important for a physician to be able to accurately predict which patients require mitigation.
Precision: 0.719 – (True Positives)/(True Positives + False Positives)
- Precision is defined as the proportion of positive results that are true positive. In this model, 46 actual deceased patients were classified correctly as deceased. There were 18 false positives or 18 actual survivors classified incorrectly as deceased.
F-1 Score: 0.730 –2 x (Precision * Sensitivity)/(Precision + Sensitivity)
- The F-1 Score provides a statistic to balance between Precision and Sensitivity, especially if an uneven class distribution exists, as in this example, (99 survivors vs 46 deceased). The closer the F-1 score is to 1 (the upper bound) the better the precision and recall.
Success Class and Success Probability simply reports the settings for these two values as input on the Random Trees: Classification Data tab.
View individual records and their classifications beneath Training: Classification Details.
CRandTrees_ValidationScore
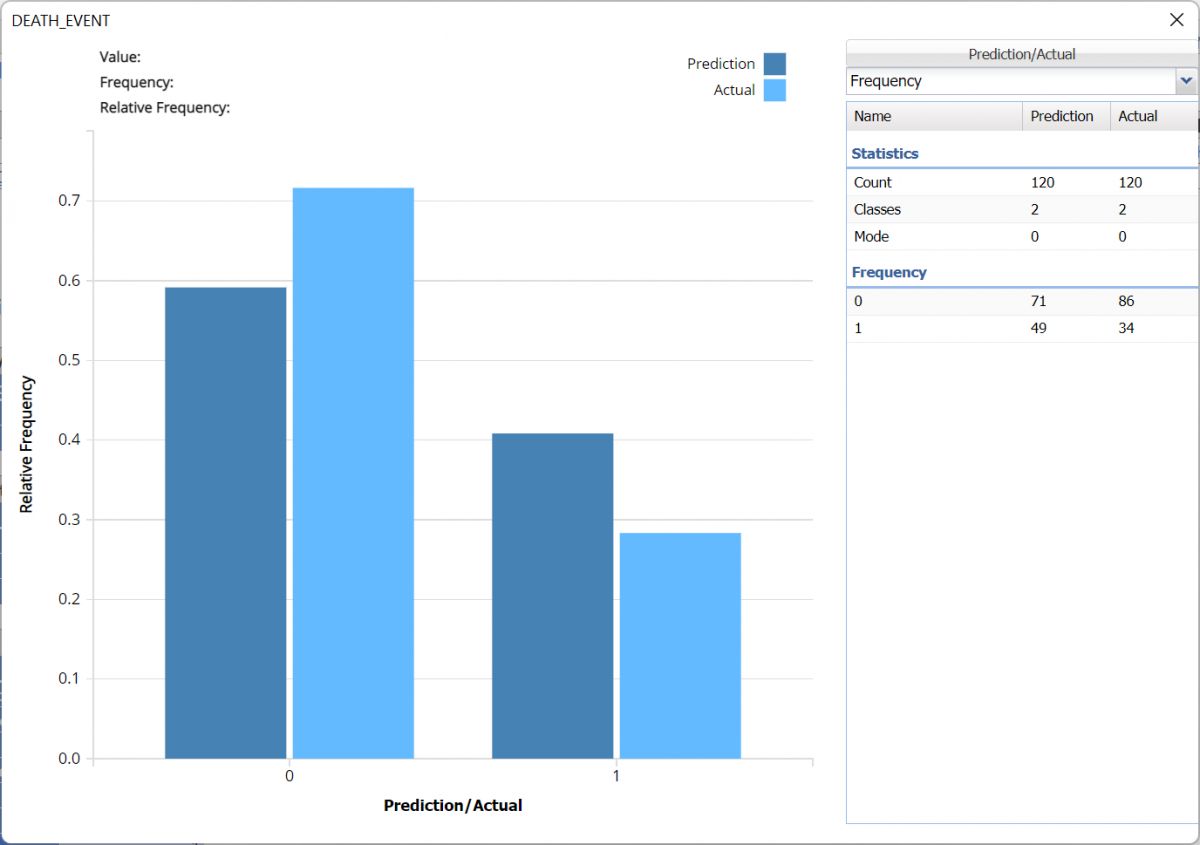
Click the CRandTrees_ValidationScore tab to view the Summary Results for the Validation partition.
The Frequency Chart quickly displays how the fitted model performed on the validation partition.
The overall error for the validation partition was 24.17 with 19 false positives (surviving patients reported as deceased) and 10 false negatives (deceased patients reported as survivors).
Validation: Classification Summary
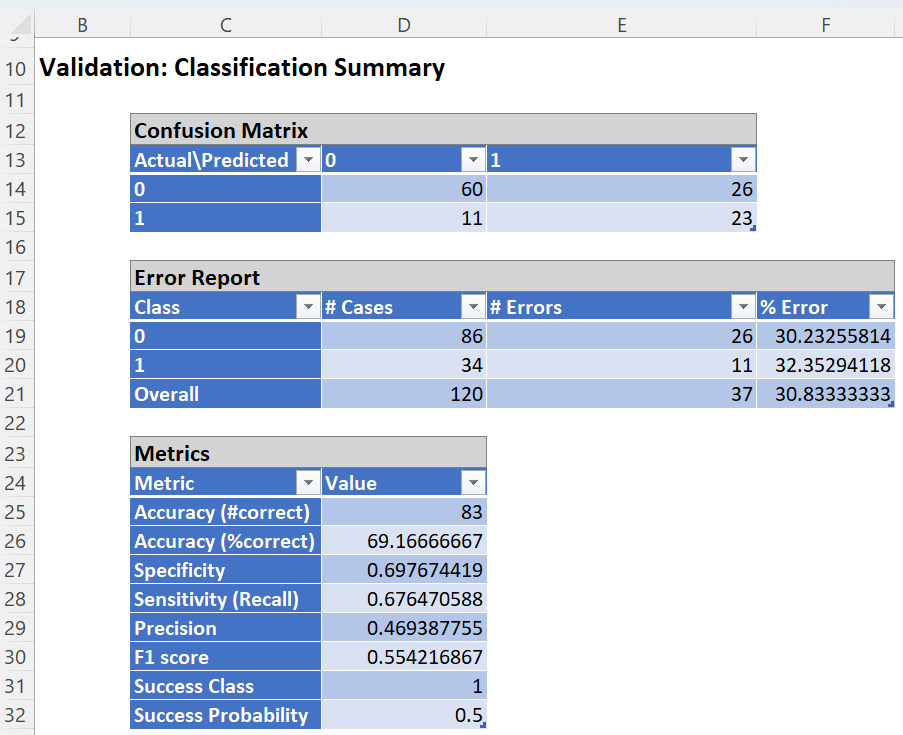
The overall error for the validation partition was 30.83 with 26 false positives (surviving patients reported as deceased) and 11 false negatives (deceased patients reported as survivors).
Note the following metrics:
- Accuracy: 69.17
- Specificity: 0.698
- Sensitivity or Recall: 0..676
- Precision: 0.469
- F1 Score: 0.554
CRandTrees_Simulation
As discussed above, Analytic Solver Data Science generates a new output worksheet, CRandTrees_Simulation, when Simulate Response Prediction is selected on the Simulation tab of the Random Trees dialog.
This report contains the synthetic data, the prediction (using the fitted model) and the Excel – calculated Expression column, if populated in the dialog. Users can switch between the Predicted, Training, and Expression sources or a combination of two, as long as they are of the same type.
Synthetic Data
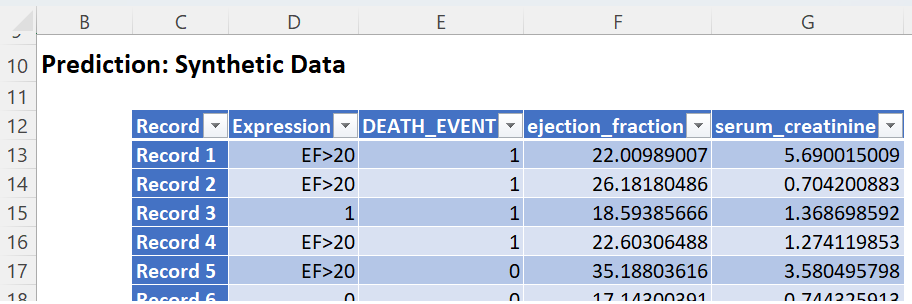
Note the first column in the output, Expression. This column was inserted into the Synthetic Data results because Calculate Expression was selected and an Excel function was entered into the Expression field, on the Simulation tab of the Discriminant Analysis dialog
IF([@ejection_fraction]<=20, [@DEATH_EVENT], “EF>20”)
The results in this column are either 0, 1, or EF > 20.
- DEATH_EVENT = 0 indicates that the patient had an ejection_fraction <= 20 but did not suffer catastrophic heart failure.
- DEATH_EVENT = 1 in this column indicates that the patient had an ejection_fraction <= 20 and did suffer catastrophic heart failure.
- EF>20 indicates that the patient had an ejection fraction of greater than 20.
The remainder of the data in this report is synthetic data, generated using the Generate Data feature described in the chapter with the same name, that appears earlier in this guide.
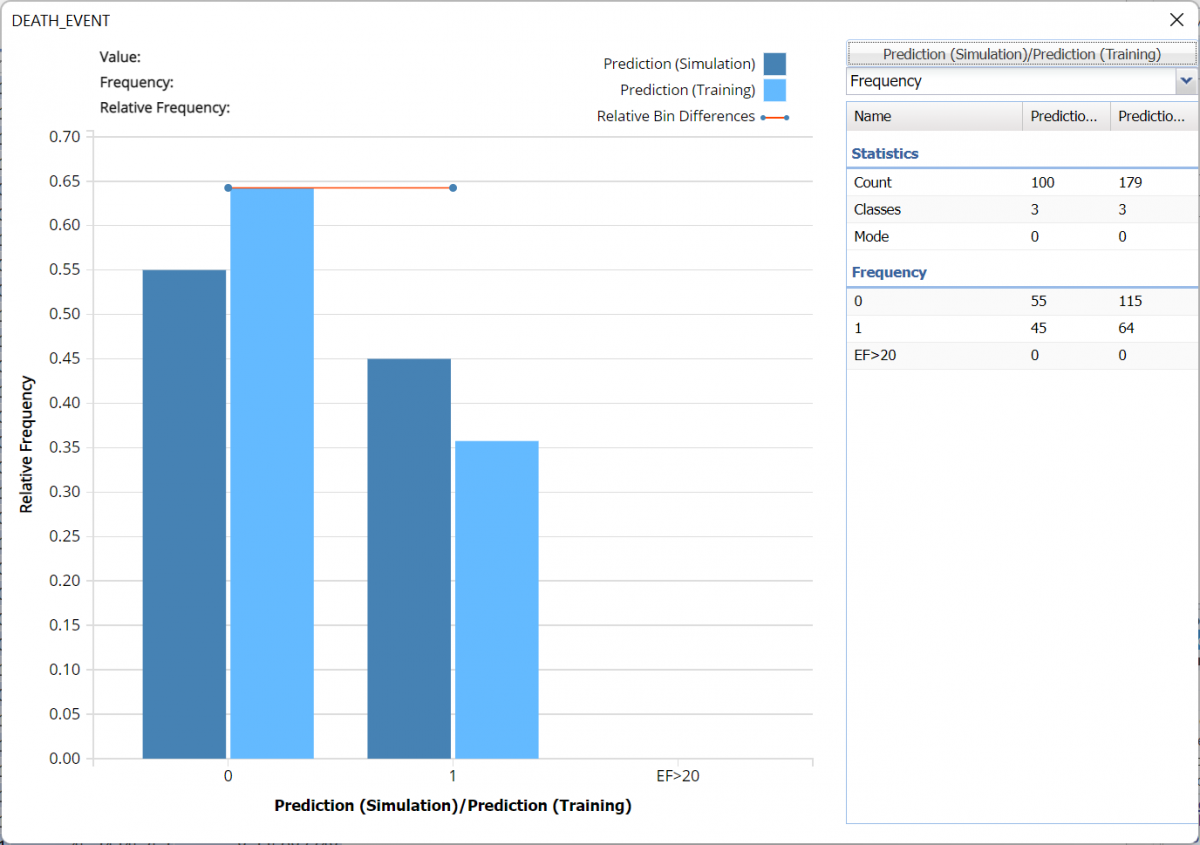
The chart that is displayed once this tab is selected, contains frequency information pertaining to the predictions of the output variable in the training partition, the synthetic data and the expression, if it exists.
The bars in the darker shade of blue display the frequency of labels in the Simulation, or synthetic, data. In the synthetic data, 55 “patients” are predicted to survive and the remaining are not.
The bars in the lighter shade display the frequency information for the training partition’s predicted values where 115 records were labeled as 0 (survivors) and 64 records were labeled as 1 (non-survivors).
The Relative Bin Differences curve indicates that the absolute differences in each bin are equal.
Frequency Chart for CRandTrees_Simulation output
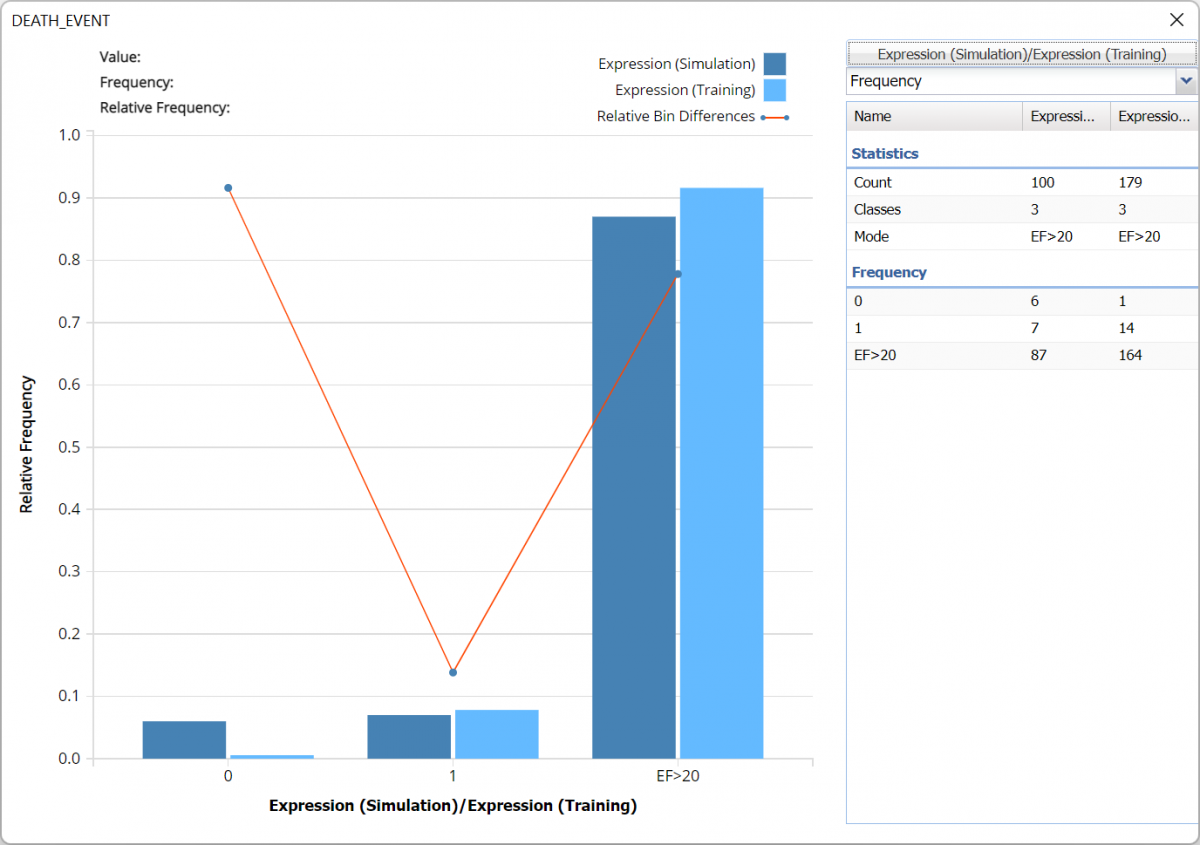
The chart below reveals the results of the expression as applied to each dataset.
The bars in the darker shade of blue display the frequency of labels in the Simulation, or synthetic, data. In the synthetic data, 6 surviving “patients” have an ejection fraction less than or equal to 20 while 7 “patients” with an ejection_fraction less than or equal to 20 did not survive.
The bars in the lighter shade display the frequency information for the training partition’s predicted values where 15 “patients”, or records, had ejection fractions less than 20; 1 patient was predicted to survive and 14 were not.
Columns labeled as “EF>20” contain the remainder of the records where the ejection fraction for each patient is larger than 20.
Frequency Chart for CRandTrees_Simulation output
For more information on the generated synthetic data, see the Generate Data chapter that appears earlier in this guide.
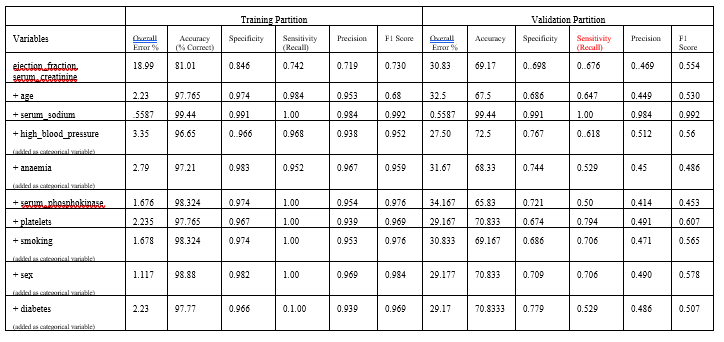
The input steps were performed multiple times while adding additional Selected Variables according to the variable's importance or significance found by Feature Selection. The results are summarized in the table below.
The lowest Overall Error in the Validation Partition for any of the variable combinations occurs when just four variables, ejection_fraction, age, serum_sodium and serum_creatinine, are present in the fitted model. In addition, this fitted model also exhibits the highest Accuracy, Sensitivity, Precision and F1 Score metrics in the validation partition. These results suggest that by obtaining these four measurements for a patient, a physician can determine whether the patient should undergo some type of mitigation for their heart failure diagnosis.