The example contained in this section uses the Wine.xlsx example file to demonstrate how to create a model using the k-Means Clustering algorithm.
Open this example file by clicking, Help – Example Models, then Forecasting/Data Science Examples.
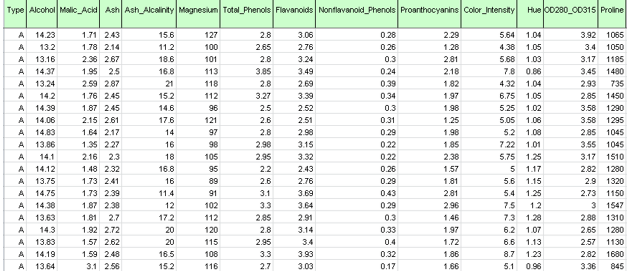
As shown in the figure below, each row in this dataset represents a sample of wine taken from one of three wineries (A, B or C). In this example, the Type variable representing the winery is ignored and clustering is performed simply on the basis of the properties of the wine samples (the remaining variables).
Wine.xlsx dataset
Inputs
Click Data Science – Cluster – k-Means Clustering to open the k – Means Clustering dialog.
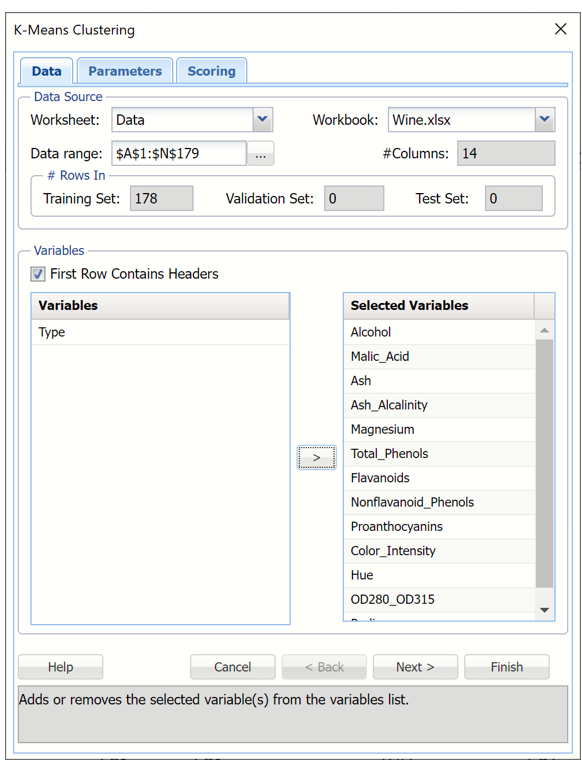
Select all variables under Variables except Type, then click the > button to shift the selected variables to the Selected Variables field.
k-Meas Clustering dialog, Data tab
Partition Data
Analytic Solver Data Science includes the ability to partition a dataset from within the k-Means Clustering method by clicking Partition Data on the Parameters tab. Analytic Solver Data Science will partition your dataset (according to the partition options you set) immediately before running k-Means Clustering. If partitioning has already occurred on the dataset, this option will be disabled. For more information on partitioning options, please see the Data Science Partitioning chapter that appears later in this guide. This example does not perform partitioning on the dataset.
Rescale Data
Use Rescaling to normalize one or more features in your data during the data preprocessing stage. Analytic Solver Data Science provides the following methods for feature scaling: Standardization, Normalization, Adjusted Normalization and Unit Norm. For more information on this feature, see the Rescale Continuous Data section within the Transform Continuous Data chapter that occurs earlier in this guide. If rescaling has already been performed, this button will be disabled. This example does not utilize the Rescale Data feature.
Afterwards, click Next to advance to the next tab.
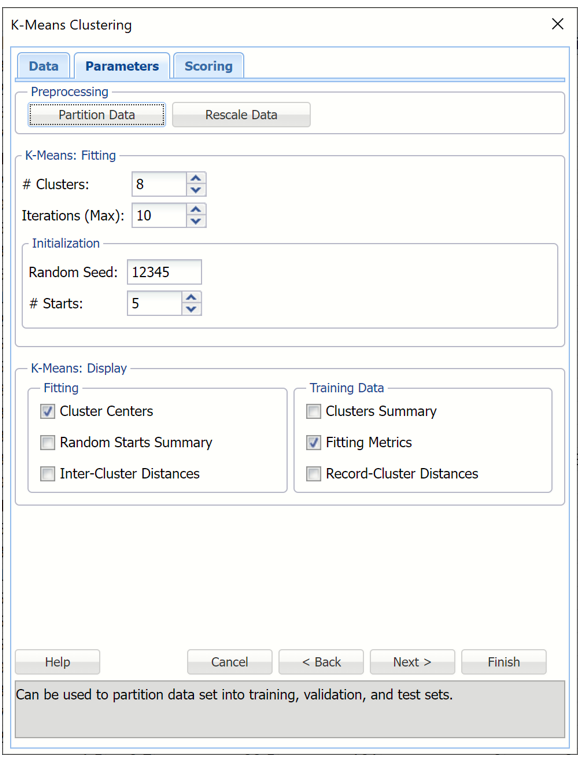
Enter 8 for # Clusters to instruct the k-Means Clustering algorithm to form 8 cohesive groups of observations in the Wine data. One can use the results of Hierarchical Clustering or several different values of k to understand the best setting for # Clusters.
Enter 10 for # Iterations. This option limits the number of iterations for the k-Means Clustering algorithm.
Random Seed is initialized to the default setting of “12345”. This option initializes the random number generator that is used to assign the initial cluster centroids. Setting the random number seed to a positive value ensures the reproducibility of the analysis.
Increase #Starts to 5. The final result of the k-Means Clustering algorithm depends on the initial choice on the cluster centroids. The best assignment (based on Sum of Squared Distances) is chosen as an initialization for further k-Means iterations.
Leave Cluster Centers selected under Fitting and Fitting Metrics selected under Training Data. For more information on the remaining output options, see the k-Means Clustering Options section immediately following this example.
k-Means Clustering dialog, Parameters tab
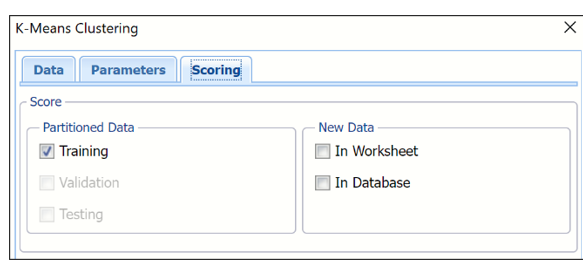
Click Next to advance to the Scoring tab. Notice that Training, under Score Partitioned Data, is selected by default. Validation and Testing are disabled under Partitioned Data since partitioning was not performed on the dataset. Analytic Solver will score the training dataset. See the Scoring chapter in the Analytic Solver User Guide for information on scoring new data In worksheet or In Database.
k-Means Clustering dialog, Scoring tab
Click Finish.
The k-Means Clustering method starts with k initial clusters. The algorithm proceeds by alternating between two steps: "assignment" – where each record is assigned to the cluster with the nearest centroid, and "update" – where new cluster centroids are recomputed based on the partitioning found in the "assignment" step.
Results
The results of the clustering method, KMC_Output and KMC_TrainingClusters, are inserted to the right of the Data worksheet.
KMC_Output
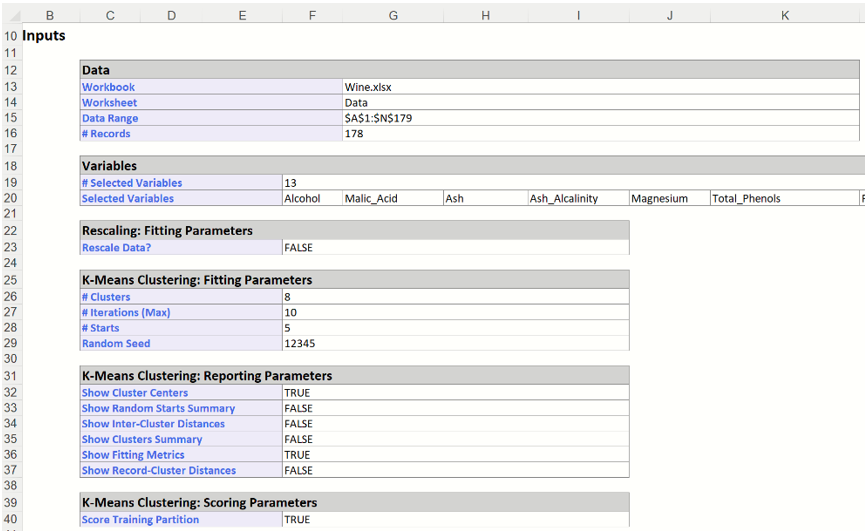
In the top section of KMC_Output, the options that were selected in the Data, Parameters and Scoring tabs are listed.
k-Means Clustering Output: Inputs
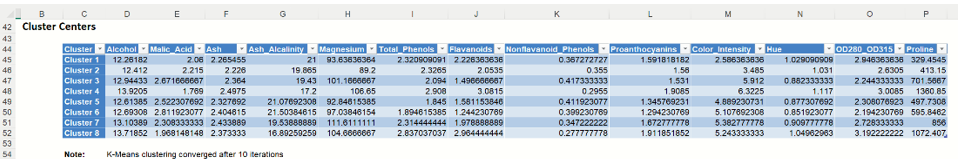
Scroll down on the KMC_Output worksheet to the "Cluster Centers" tables (shown below – click the Cluster Centers link in the Output Navigator to view), displays detailed information about the clusters formed by the k-Means Clustering algorithm: the final centroids and inter-cluster distances. If the input data was normalized, k-Means Clustering operates on rescaled data. Results are not transformed back to their original scale.
k-Means Clustering Output: Cluster Centers
KMC_Training Clusters Output
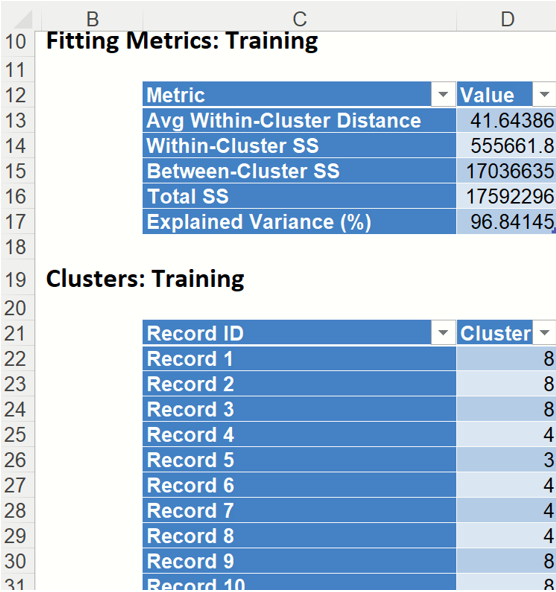
Click the KMC_TrainingClusters worksheet to view the Fitting Metrics for the training dataset and Cluster assignments for each record.
Fitting Metrics: This table lists several metrics computed from the training dataset. (Recall that our training dataset is the full dataset since we did not partition into training, validation or test partitions.)
- Avg Within-Cluster Distance – Average total distance from each record to the corresponding cluster center, for each cluster.
- Within Cluster SS – Sum of distances between the records and the corresponding cluster centers for each cluster. This statistic measures cluster compactness. (The algorithm is trying to minimize this measure.)
- Between Cluster SS – Sum of distances between the cluster centers and the total sample mean, divided by the number of records within each cluster. (Between Cluster SS measures cluster separation which the algorithm is trying to maximize. This is equivalent to minimizing Within Cluster SS.)
- Total SS – Sum of distances from each record to the total sample mean, Total SS = Within Cluster SS + Between Cluster SS.
- Explained Variance (%) – Goodness of fit metrics, showing the degree of internal cohesion and external separation, Explained Variance % = Between Cluster SS / Total SS.
Clusters: Training - This table displays the final cluster assignment for each observation in the input data – the point is assigned to the "closest" cluster, i.e. the one with the nearest centroid.
k-Means Clustering Output: Fitting Metrics and Clusters for Training Partition