The Error Report for an automated neural network for a dataset with 2 classes in the output variable will look slightly different. Open the file Charles_BookClub.xlsx by clicking Help – Example Models on the Data Science ribbon, then Forecasting/Data Science Examples. This dataset contains data related to book purchases, customer demographics and purchase history as recorded by real-world book seller.
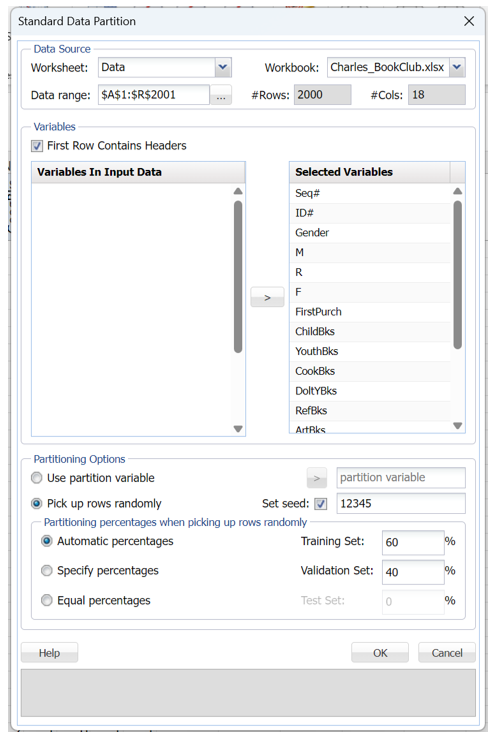
First, we partition the data into training and validation sets using the Standard Data Partition defaults of 60% of the data randomly allocated to the Training Set and 40% of the data randomly allocated to the Validation Set. For more information on partitioning a dataset, see the Data Science Partitioning chapter.
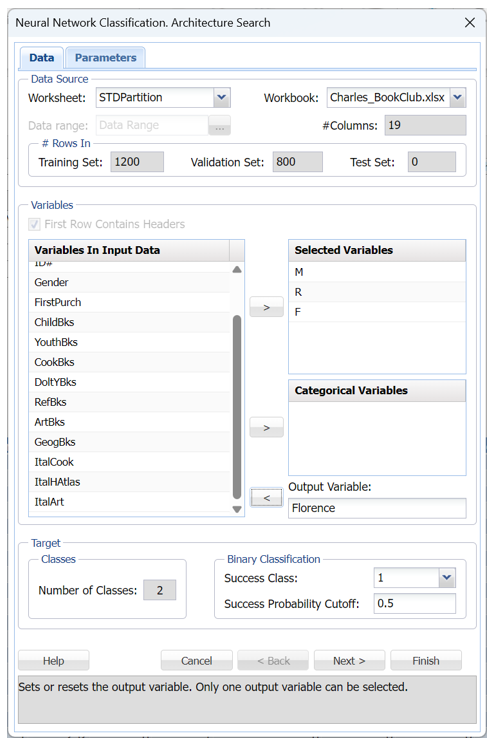
Select a cell on the STDPartition worksheet, then click Classify – Neural Network – Automatic Network on the Data Science ribbon. Select Florence (has 2 classes) for the Output variable and the M, R, and F variables as Selected variables.
The Number of Classes statistic will be automatically updated with a value of 2 when the Output Variable is selected. This indicates that the Output variable, CAT.MEDV, contains two classes, 0 and 1.
Choose the value that will be the indicator of “Success” by clicking the down arrow next to Success Class. In this example, we will use the default of 1 indicating that a value of “1” will be specified as a “success”.
Enter a value between 0 and 1 for Success Probability Cutoff. If the Probability of success (probability of the output variable = 1) is less than this value, then a 0 will be entered for the class value, otherwise a 1 will be entered for the class value. In this example, we will keep the default of 0.5.
Click Finish to accept the default settings for all parameters. Open the sheet, NNC_Output, which will be inserted to the right of the STDPartition sheet. Scroll down to the Architecture Search Error Log.
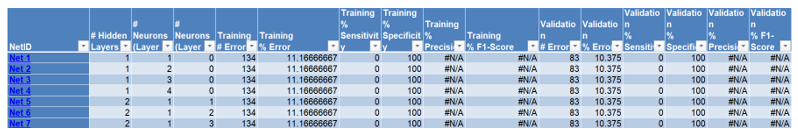
The above error report gives the total number of errors, % Error, % Sensitivity (also known as true positive rate) and % Specificity (also known as true negative rate) in the classification produced by each network ID for the training and validation datasets separately. As shown in the Automatic Neural Network Classification section above, this report may be sorted by column by clicking the arrow next to each column heading. In addition, click the Net ID hyperlinks to re-run the Neural Network Classification method with Manual Architecture with the input and option settings as specified in the specific Net ID.
Let’s take a look at Net ID 5. This network has two hidden layers, each containing 1 nodes. For this neural network, the percentage of errors in the training data is 11.16% and the percentage of errors in the validation data is 10.375%. Click the Net5 link in cell C68 to open the Nueral Network Classification dialog. Notice that the Selected Variables and Output Variable have been prefilled in the Data tab. If you click Next, you will find that all Parameters have also been prefilled in the Parameters tab. Click Finish to fit the model.
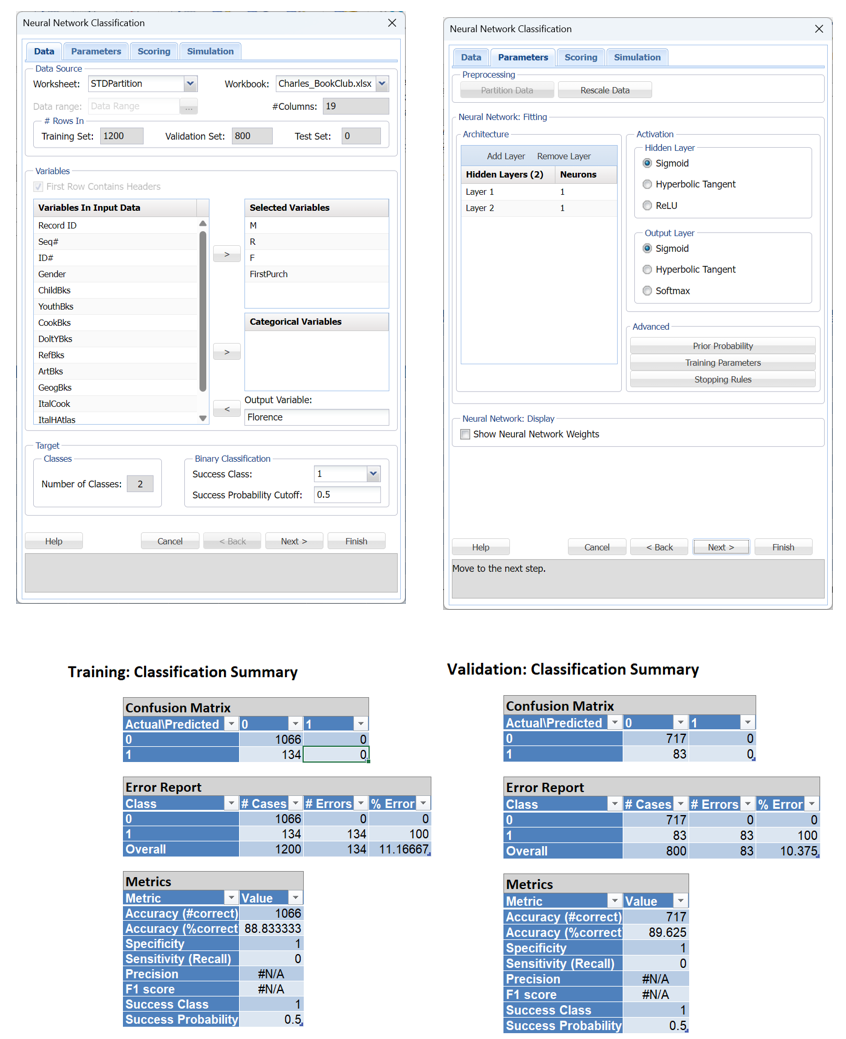
The confusion matrices for both partitions are above. Notice the #N/A errors for both Precision and F1 Score in both. Recall that Precision is calculated as True Positives / (True Positives + False Positives) or, in the case of the training partition, 0/(0 + 0). The F1 Score is calculated as 2* (Precision * Recall)/(Precision + Recall), since Precision resulted in an error, F1 also results in an error.