Two-Factor ANOVA, also known as factorial analysis, is an extension to the one-way analysis of variance. In a two-factor analysis, there are two variables, rather than one as in a single factor analysis. The assumption is that both variables, or factors, affect the dependent variable. Each factor contains two or more classes and the degree of freedom for each variable is one less than the number of levels.
In a two-factor ANOVA there are two sets of hypothesis:
- The sample means of the first factor (variable) are equal.
- The sample means of the second factor (variable) are equal.
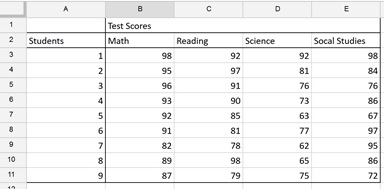
In the example below, test scores have been recorded from nine different students.

To perform a two factor ANOVA without Replication:
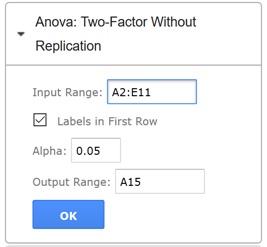
- On the XLMiner Analysis ToolPak pane, click Anova: Two-factor Without Replication.
- Click the Input Range field and enter the cell range A2:E11.
- Leave "Labels in First Row" selected since the first row in the data range includes the column labels.
- Leave Alpha at the default of 0.05. This is the level of significance for the hypothesis test.
- Click the Output Range field and then enter cell A15
- Click OK.

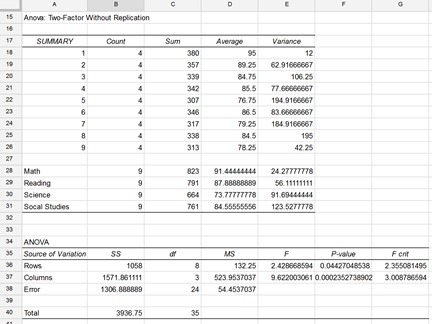
The results are shown below.

Rows refers to test scores for each of the nine students. Cell F36 contains the p-value for the calculated value of F (in cell E36) found by the Analysis ToolPak. Notice that the p-value or probability of obtaining an F statistic of 2.355 or larger when the null hypothesis is true is 0.04427. Since the p-value is less than the specified alpha of 0.05, the null hypothesis is rejected; there is a significant statistical difference between the means of each student's test scores.
Columns refers to the four categories of test scores: mathematics, reading, science and social studies. The p-value in cell F37 is very close to 0. This means that the probability of obtaining an F statistic of 3.01 or larger when the null hypothesis is true is also very close to 0. Since the p-value is less than the specified alpha of 0.05 and the calculated F statistic is much larger than the value for F crit, the null hypothesis is rejected. There is a significant statistical difference in the calculated means of the four categories. Support for this statement can be found in cells D28:D31 which display the average values for each category.
