Using Interactive Simulation
So far, we've modified an ordinary spreadsheet model by defining selected cells as uncertain variables, and one cell (Net Profit) as an uncertain function. That's it! We now have a risk analysis model in the form required by Risk Solver. We're now ready to run a Monte Carlo simulation, and see how uncertainty affects our spreadsheet model.
With an old-fashioned simulation software package, you'd press a button to start a simulation, then perhaps get a cup of coffee. Because simulations ran slowly, software packages were designed for "batch" operation: You'd spend time getting everything set up just right, run a simulation and wait (sometimes quite a while), then spend time analyzing the results. But with Risk Solver, simulations run so fast that fully Interactive Simulation is practical. To turn on Interactive Simulation, we simply click the Simulate light bulb on the Ribbon. It will “light up,” as shown below. In the blink of an eye, your first Monte Carlo simulation is complete!
From now on (until we click the light bulb again to turn it off), 1,000 Monte Carlo simulation trials (the default number) will be run each time you change the spreadsheet, and cell F11 will display the average Net Profit for these 1,000 trials:
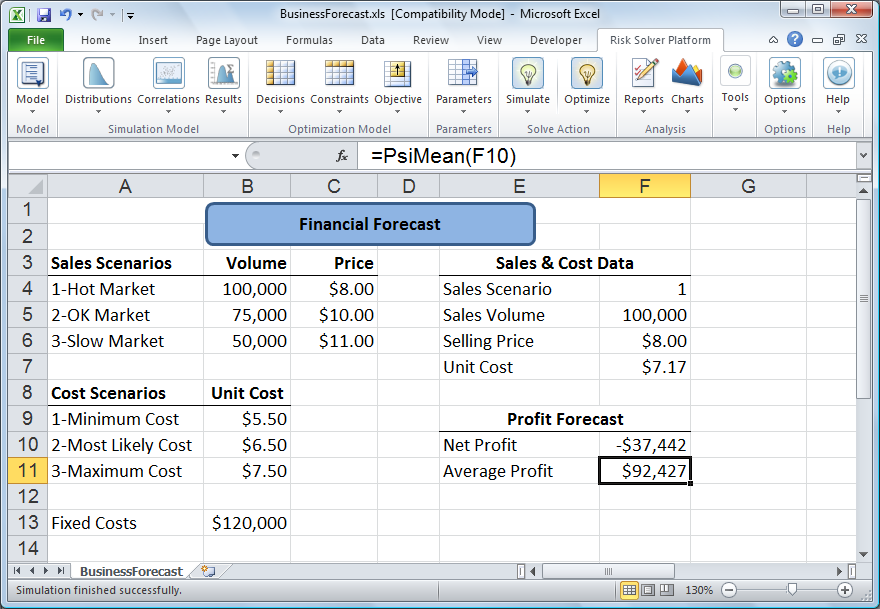
The result of “shaking the ladder” is striking: Our average Net Profit for these 1,000 trials is only $92,427– quite a bit less than the Flawed Average Model figure of $117,750! And we also see that we can lose money -- the last of the 1,000 trials, which appears on the worksheet, shows a loss of $37,442. Each time you press function key [F9] (the Excel recalculate key), another 1,000 Monte Carlo trials are run, and a slightly different average Net Profit figure will be displayed (based on the new sample of 1,000 trials) -- but the average will nearly always be much less than $117,750.
< Back to: Monte Carlo Simulation Tutorial StartNext: Viewing the Full Range of Profit Outcomes >