Using Uncertain Functions and Statistics
We’ve now defined the uncertain variables in our risk analysis model. Anything calculated from these uncertain variables is an uncertain function, but usually we’re interested only in specific results such as Net Profit in cell F10. When we “turn on” Interactive Simulation, F10 will effectively hold an array of values, each one calculated from different values sampled for F4, F5, F6 and F7.
What would we like to know about the array of values for Net Profit at cell F10? The simplest summary result is the average (or mean) Net Profit. Note that this will be the average Net Profit across 1,000 or more scenarios or trials -- not a single calculation from average values of the inputs. With cell F10 selected, we click the Results button on the Risk Solver Ribbon followed by clicking on the Statistics option which shows us the available statistics functions, which we can "drag and drop" into a worksheet cell.
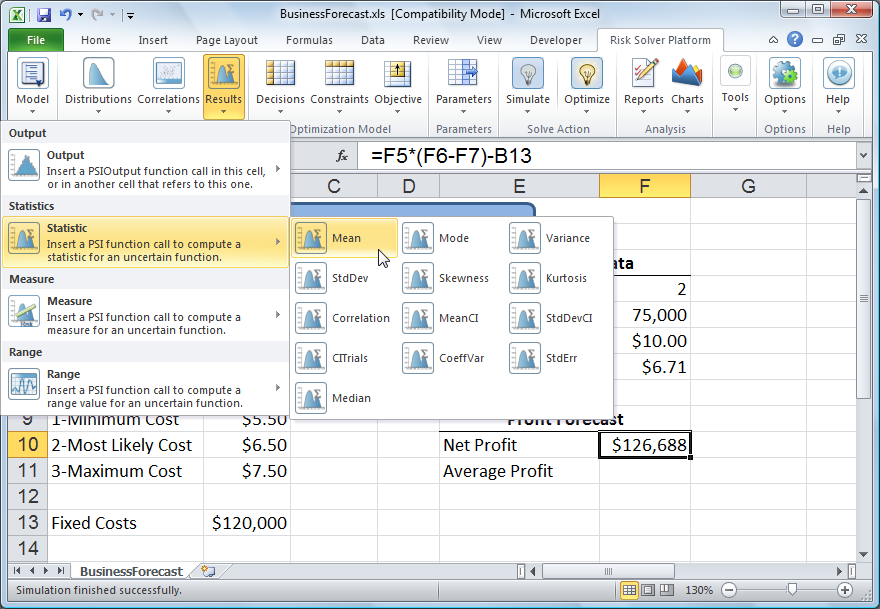
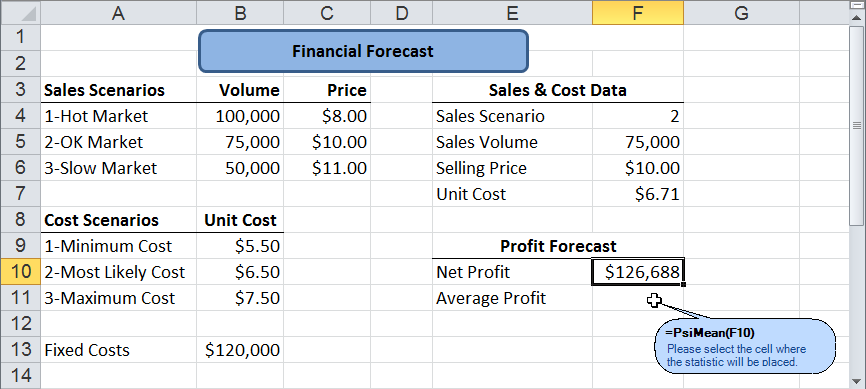
When we click the Mean button, a small “balloon” like the one below appears and follows the mouse pointer as we move to a worksheet cell, in this case F11. When we click F11the formula =PsiMean(F10) appears in the cell. (Note that you could also type the formula =PsiMean(F10) in cell F11.)
When we define a summary statistic, such as PsiMean(F10), we’ve implicitly designated cell F10 as an uncertain function. Risk Solver will keep track of the full range of trial values for F10 during a simulation, and will display frequency and sensitivity charts, statistics and percentiles for it on demand. As noted above, in principle anything calculated from the uncertain input variables is an “uncertain function” -- but to save time and memory, Risk Solver keeps track of trial values only for the formula cells that we designate. There are several ways (besides using a statistic such as PsiMean) to designate a cell as an uncertain function.
< Back to: Monte Carlo Simulation Tutorial Start Next: Interactive Simulation >