Viewing a Summary of the Model
In this tutorial, we’ve used Risk Solver to define two uncertain variables (an integer uniform distribution to model the Market State and a triangular distribution to model the Unit Cost), one uncertain function (Net Profit), and one summary statistic (the Mean or True Average). In a larger model, we might define a great many uncertain variables and functions, statistics, and correlation matrices on a worksheet. They might even be spread across multiple worksheets in a workbook. How do we find them? Since all of Risk Solver’s function start with 'Psi’, we could use the Excel Find function to search for formulas containing this string. But Risk Solver provides an easier way.
Clicking the Model button on the Risk Solver Ribbon toggles on and off the Risk Solver task pane (shown below) that provides a summary of your entire risk analysis model in outline form. You can expand and collapse outline groups by clicking the + or - icons that appear in this display. You can quickly locate cells containing uncertain variables, uncertain functions, statistics, or correlation matrices.
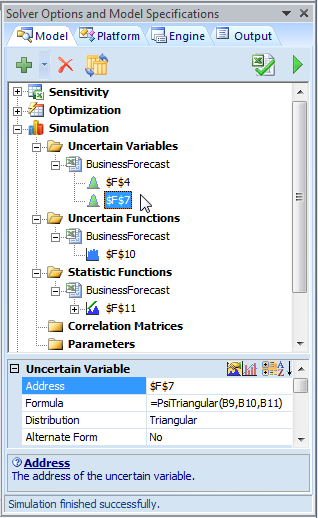
A single-click on any of the cells displayed in the task pane will display the properties associated with the selection at the bottom of the task pane. For instance, with cell F7 selected in the Uncertain Variables section of the task pane, the Formula and Distribution settings associated with this cell are displayed. This provides a very convenient way to inspect, veryify and adjust settings for your simulation model.
Conclusion
This concludes our Monte Carlo Simulation Tutorial -- we hope you've enjoyed it! If you haven't done so already, consult our Risk Analysis Tutorial -- it's designed to sharpen your thinking about uncertainty and risk, and how to identify and quantify the uncertainties you face. For background on simulation analysis and simulation models, consult our Simulation Introduction.
< Back to: Monte Carlo Simulation Tutorial Start
<< Back to: Simulation Tutorial Homepage