
Business leaders always must strike a balance between potential risks and returns from different projects as they decide how to allocate resources. In the same way that investment managers consider the possible risks and rewards of different stocks, bonds, or other financial assets, business leaders should take a “portfolio approach” to their project mix. Just as you want to have a diversified set of assets in an investment portfolio, it’s important to bring this same style of “portfolio thinking” to your business decisions about which projects to fund.
Businesses invest in new projects in the expectation of earning a positive return on their investment (ROI). But some projects may fail or fall short of expectations, while others may outperform. By balancing the risks and rewards of different projects, business leaders can maximize the risk-adjusted return of the entire “portfolio” of projects.
If you’re investing for retirement, putting all of your savings in one stock is excessively risky – most people understand that investing in a broadly diversified portfolio of financial assets can help you manage risks and meet your retirement goals. In the same way, business leaders can use simulation and optimization modeling to quantify and manage the risk of projects. The right tools can help them choose the optimal mix of projects to fund to meet goals for ROI as well as limits on acceptable risks.
Let’s look at how to use simulation modeling and optimization – and the capabilities of Analytic Solver® – to create an efficient portfolio of projects to maximize your chances of business success.
Choosing a “Project Portfolio”
Every day, in a wide range of industries, business leaders must choose which projects to fund and which projects to prioritize. There are costs and downside risks to every project, as well as possible upside. Based on the business’s analysis and understanding of its customers, industry, and market conditions, certain projects are going to be more likely to succeed than others.
The goal of a business leader: find the least risky project mix that still satisfies other criteria - such as expected and/or minimum cash flow, or overall combined ROI.
Here are a few examples of what a project portfolio looks like to business leaders in various industries:
- Pharmaceuticals: A pharmaceutical company is running several clinical trials for new drugs. Each one of these trials is a project; they have different likelihoods of success and different possible payoffs.
- Oil/Energy Exploration: An oil company is drilling multiple wells where they believe significant oil deposits will be found. Each of these oil wells is a project, each has risks and payoffs.
- Investing: A portfolio of stocks or bonds or securities is also a mix where you want the least risky mix of stocks that will achieve some objective/rate of return.
Despite the industry differences, there are common analytical techniques that business leaders can apply to find the optimal set of trade-offs across such a portfolio of projects. The goal: create an “efficient portfolio” of projects that are less risky than the individual projects, that delivers a desirable total cash flow or rate of return. This problem can be tackled with optimization, and when there are multiple uncertainties, simulation and optimization.
Why a “Project Portfolio” is like a Stock Portfolio
Business leaders are generally familiar with the idea of a “portfolio of stocks.” Most of us are using this concept of portfolio investing in our retirement savings. Many companies own a portfolio of assets or products, with the idea that the combined strength of these assets will outperform the individual assets.
Creating a portfolio of projects has strong similarities to creating a portfolio of stocks. With a diversified portfolio of stocks, you are ideally helping to manage the risks compared to investing in an individual stock. Risks are present with each stock, but the risks of one stock can offset the risks of another. The key idea is to identify risks that can offset each other, and take advantage of these in constructing the portfolio.
A classic example: an oil company’s profits are highly sensitive to the price of oil. So, when the price of oil goes down, the oil company’s stock likely goes down. However, airline stock prices are inversely correlated to the price of oil. Jet fuel accounts for close to 50% of the cost of each airline flight, so when the price of oil goes down, airline stock prices tend to go up, and vice versa. Hence, if you want to offset the risk of declines in the price of oil, you can combine oil company stock and airline stock in the same portfolio. That's the basic idea of offsetting risks in a portfolio.
Now let’s see how optimization can help business leaders make better-informed decisions about their project portfolio.
Example: Markowitz Portfolio Optimization
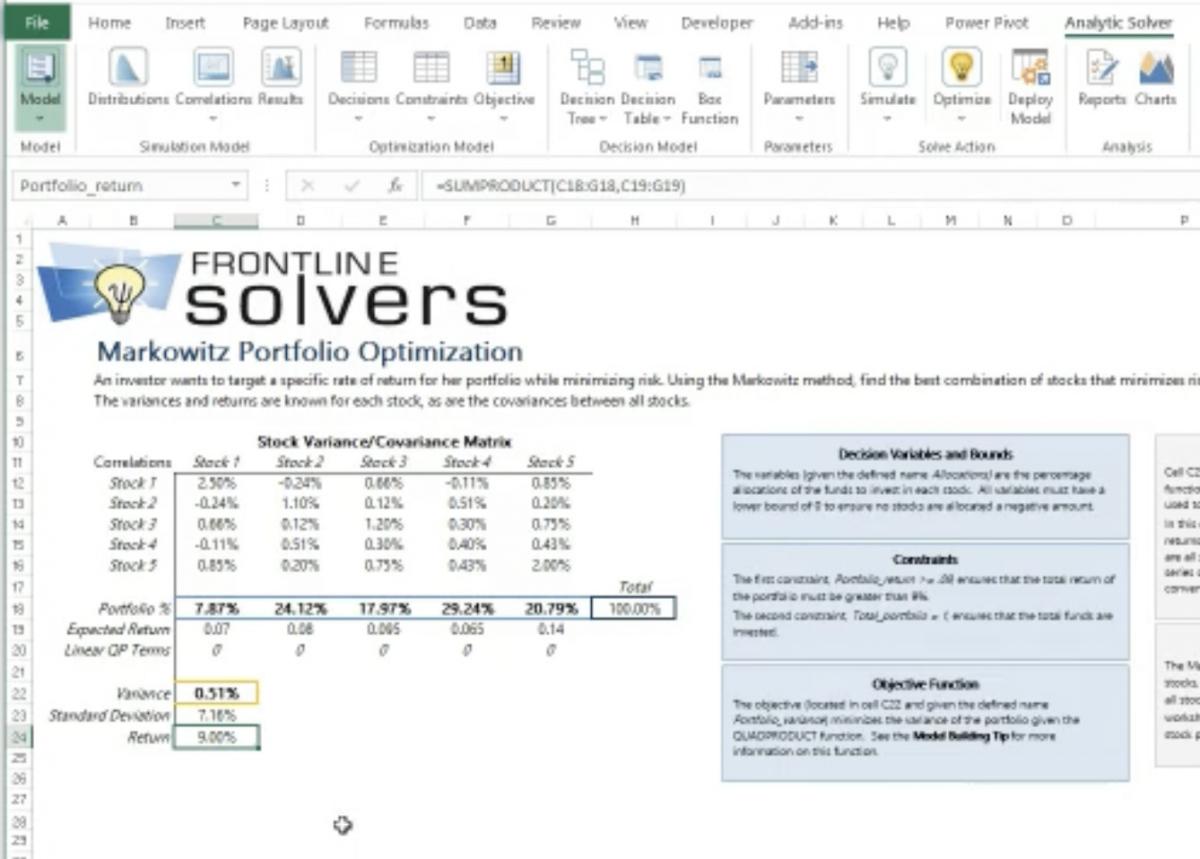
In one of the example models we include with Analytic Solver®, analysts can use the Markowitz Portfolio Optimization model find an “efficient portfolio” of stocks. The term “efficient” – coined by Nobel prize winner Harry Markowitz – means that the portfolio earns the highest possible (or optimal) return of return for a given level of risk, where risk is measured by variance, the statistical measure of the portfolio’s fluctuation in total value.
The Markowitz model requires as inputs an estimated rate of return and variance (fluctuation in returns) of each individual stock, and the covariances of returns between each pair of stocks. Some stocks will be riskier (have greater fluctuations or variance) than others, but some pairs of stocks will have negative covariances – their fluctuations offset each other – and most pairs of stocks will have covariances less than 1.0 (perfect correlation – always rising or falling together). From all the possible combinations of funds invested in these stocks, the optimization process will find the best or optimal combination for a given level of risk.
Note that we don’t need negative covariances between stocks (or projects) to achieve a better risk-adjusted outcome than single stocks (or projects) alone. We can take advantage of even weak positive covariances to construct a portfolio with superior risk-adjusted returns.
Optimization can also be used for bond investments over time – deciding the best way to allocate money across these investments to meet future obligations such as pension payments, while earning the best possible return. In this kind of model – another of the standard examples included with Analytic Solver – we explicitly take into account the cash flows, including interest and principal payments – of the bonds over time.
Optimization of Project Portfolios in the Physical World
Projects in the physical world often take place over multiple time periods, and have expected cash flows per period – negative up front as we invest, then positive in future periods when a project starts to pay off. That is much like the multi-period bond investment model we explored above. But these projects can also have (significant) fluctuations in their future streams of payoffs – much like the stocks in the Markowitz portfolio model above.
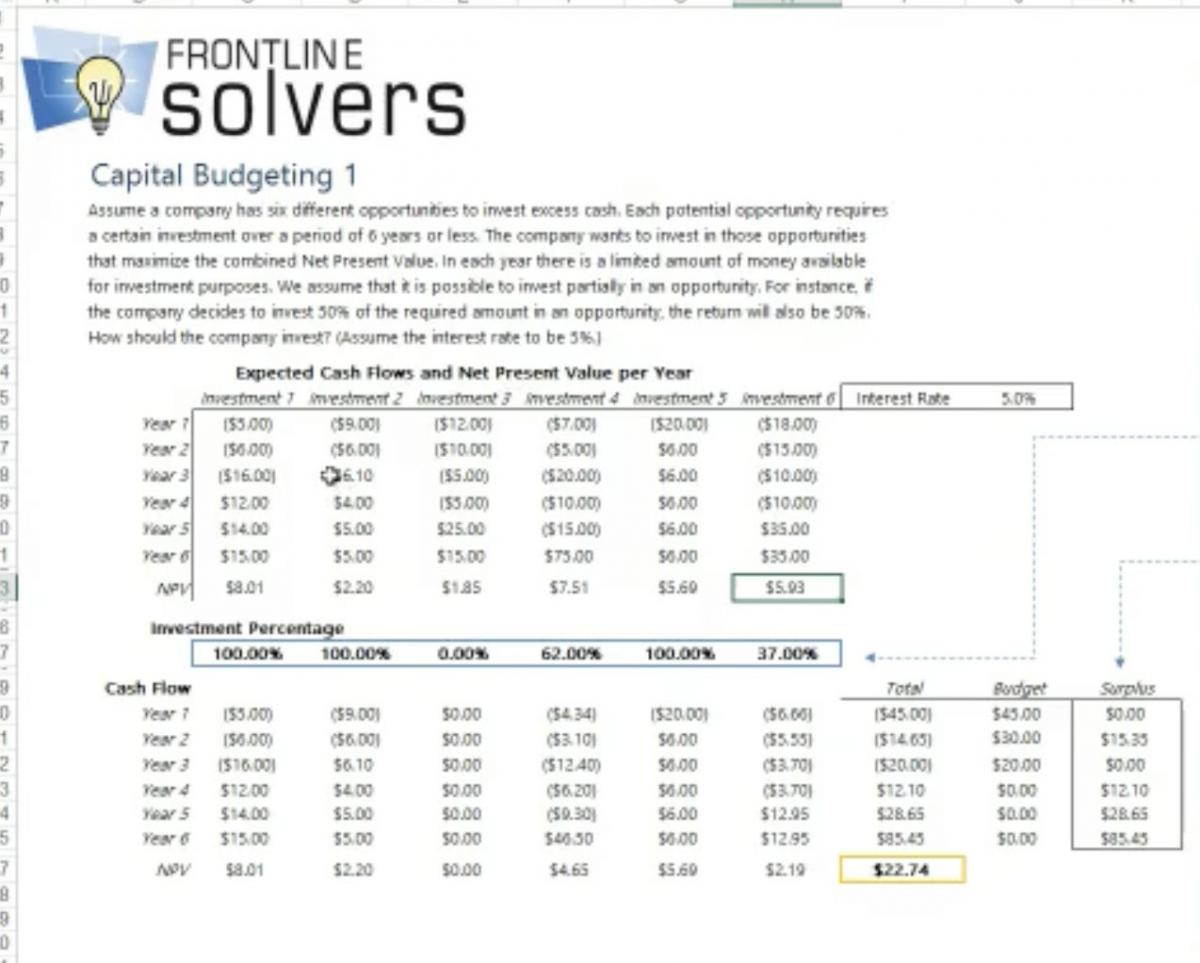
Let’s first examine the situation where we must choose among multiple projects that are “competing” for our company’s investment funds, where the projects take place over multiple time periods and have different – but relatively well-known – cash flows per period. This situation is illustrated in the “Capital Budgeting 1” worksheet of the Capital Budgeting example workbook included with Analytic Solver®.
In this example, your company is considering investments in 6 different projects, and each is expected to earn certain cash flows over time. You can’t invest in everything (you have an overall budget constraint) – you must pick and choose. And you have a given “hurdle rate”, or rate of return you must earn to justify the investment. (In this simple example, we also assume that you can make a “partial investment” in a project – later we’ll consider “all or nothing” project investments.) With the optimization capabilities of Analytic Solver®, you can find the best or optimal choice of investments that will maximize the Net Present Value (at your hurdle rate) of these projects, subject to your budget constraint.
Next level of portfolio thinking: Accounting for uncertainty
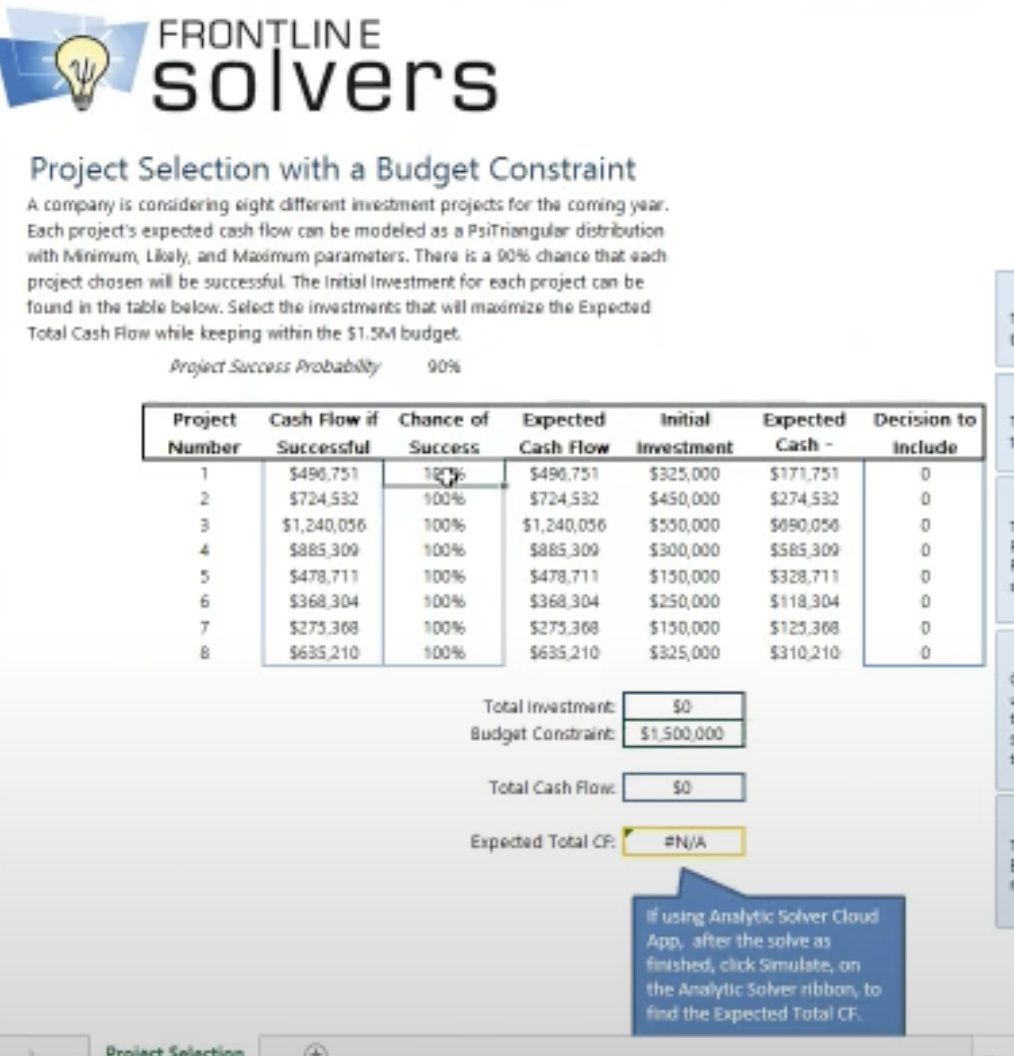
Now let’s consider a more challenging (and often more realistic) example: Your company is considering eight different projects, and you have a total budget of $1.5 million to invest. Each project has a different expected cash flow and initial investment – but now each project has uncertainty: For each project we’ll estimate the chance of success or failure, and also consider a range of possible cash flows it can produce if the project succeeds (versus zero cash flow if it fails). And these are “all or nothing” projects – you can’t “invest partially” in some of them, you must fully fund the project, or leave it out of the mix.
Recall that the Markowitz model we discussed earlier needs as inputs certain statistics: the variance of returns for each stock, and covariances between each pair of stocks. Since public stocks and bonds are traded regularly and price histories are recorded, the data is available to compute these variances and covariances. But that’s usually not the case with projects in the business world.
With most capital budgeting software, and even with most optimization software, you would either be unable to solve this problem, or you’d be limited to “optimizing” based on simplistic estimates of the relationships among projects and their cash flows. But with Analytic Solver® – thanks to its fully integrated simulation optimization and stochastic optimization capabilities – you won’t have these limitations.
We’ll skip some details, but with Analytic Solver® we can express the conditions described above on a simple one-page Excel worksheet, with one row for each of the eight projects. For each project, we define a “chance of success or failure” with a discrete (Bernoulli) distribution, and a range of possible cash flows (if the project succeeds) with a continuous (Triangular) distribution. Analytic Solver will run a thousand different – automatically, randomly sampled – scenarios, computing the successes, failures and cash flows for each scenario. And it will do this repeatedly – hundreds or thousands of times – for many combinations of project investment decisions.
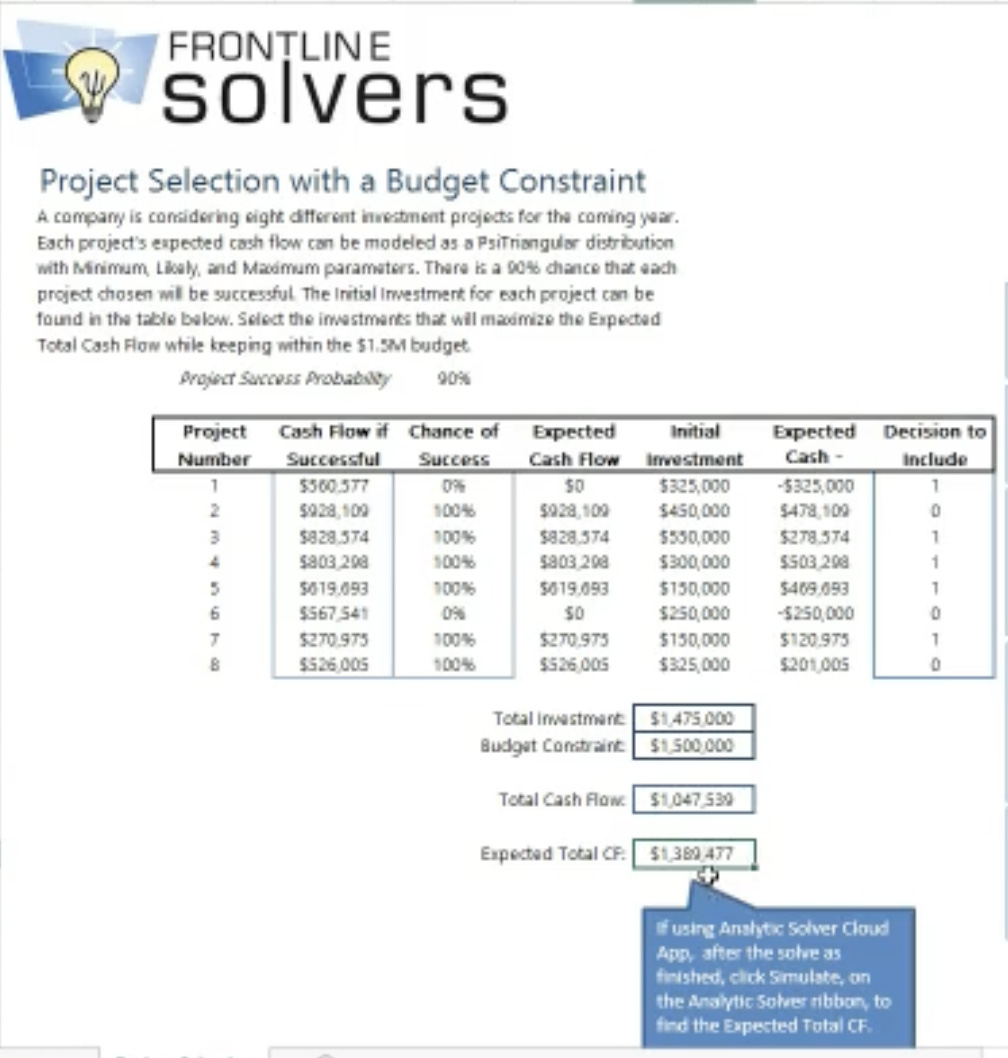
Since these are “all or nothing” projects, we can use “binary decision variables” for the eight decisions to fund a project. Analytic Solver will ensure that these variables have a value of either 1 (funded) or 0 (not funded) at the optimal solution. As you can see in the image below, for the given projects, chances of success or failure, and projected cash flows, and a budget constraint of $1.5 million, Analytic Solver finds that the optimal decision is to fund projects #1, 3, 4, 5, and 7, for an expected total cash flow of over $1.3 million.
Portfolio Approach: Driving Business Outcomes
Managers get paid to make bets; to make business decisions where there is uncertainty involved. And managers are always, understandably, interested in business outcomes. But before you can make a good decision, you’ve got to have some numbers to assess the parameters and risks of your decision. In any real-world situation, you can make a good decision and still have a bad outcome. With any one roll of the dice or spin of the roulette wheel, you can still lose. But if you use the best quantitative methods and “play the odds” effectively over time, your track record will very likely outshine other managers who make decisions “by gut feel”.
This is why portfolio thinking, and the optimization and simulation capabilities of Analytic Solver®, are so important to help drive better decisions across multiple industries. Portfolio thinking for decision-making is de rigueur in finance; they are familiar with variance and covariance, and they know about Markowitz and Sharpe. In other industries, portfolio thinking is still an emerging concept.
A Real-World Example of a Portfolio Approach, from the Oil Industry
Here’s an example of how portfolio thinking – beyond the investment management industry – can drive better decisions about allocating resources for projects in the physical world:
Some years ago, a major international oil company used our software for a composite portfolio project analysis. Their headquarters were in Europe and they were investing in oil well drilling and production projects around the world. The company had individual country-level managers, but now they were doing this kind of composite portfolio project analysis at a global enterprise level.
As you can imagine, most drilling and production projects are sensitive to the publicly-traded price of crude oil. However, this company had projects in many different countries that were also sensitive to economic, political and other factors in each country.
For example, the company had a production project underway in Nigeria and another project in Norway. They would worry about the risk of civil unrest in Nigeria that would interrupt production in the oil fields. Since Nigeria is at times a significant contributor to the world oil supply, trouble in Nigeria would be bad for the company in Nigeria – but because it would drive up the price of oil in that time frame, it would be good for the company in Norway. Nigeria’s and Norway’s risks could offset each other.
The company analyzed a lot of situations and project risks of this nature. They had to plan for these risks, with many exogenous factors they couldn’t control like decisions made by OPEC, or the performance of the world economy to drive global oil demand.
But by using composite portfolio project analysis, by bringing in these country managers, the company could have internal debates about what could happen across their portfolio of projects, and what were the risks, scenarios, and tradeoffs. They could make better-informed decisions and have more open conversations about “We’re going to put more money into this other country’s project versus your project, and here’s why.” And that transparency and collaboration yielded a higher level of buy-in from the country managers.
There’s an important point in this company’s experience: A good analytic model can be used to find the best or optimal combination of projects to invest in – exploring far more combinations that a human analyst ever could, even with a “what-if” tool like Excel. But a good analytic model can also yield a “higher level” of understanding for the analysts who use the model. And in organizations composed of many people who need to work together, a good analytic model – in a form like an Excel worksheet that everyone can relate to – can yield shared understanding and better collaboration.
How will you apply portfolio thinking and analytic methods to projects in your company? We’ve love to hear, and we’re available to help!
Want to see how the Analytic Solver® simulation and optimization capabilities can help you manage risks and maximize the outcomes of your business projects? You can try it for free. Request your Free 15-Day Trial!