Using Risk Solver Excel Functions in Deployed Applications
You can use any of Risk Solver's 80 Excel functions in your deployed application workbook -- including PSI Distribution functions that define probability distributions, PSI Property functions that shift, lock and truncate distributions, and PSI Statistic functions that return statistics, risk measures, and other summary results.
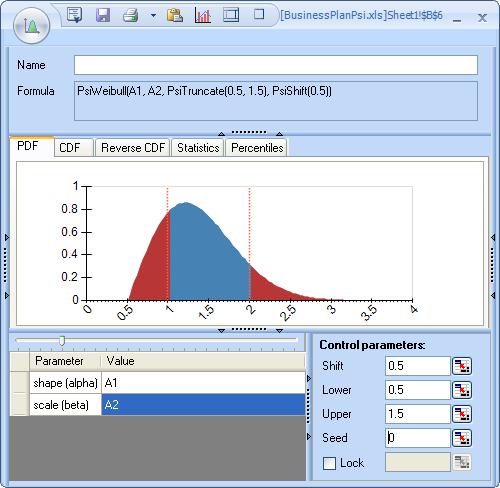
You can use Risk Solver's Uncertain Variable dialog to create and customize probability distributions for your uncertain variables.
Once you're finished, all of the distribution information is stored in PSI Distribution function and PSI Property function calls, in ordinary formula cells on your worksheet. Unlike some other risk analysis products for Excel, Risk Solver has no "hidden information" that can be viewed only through the GUI. The formula you see at the top of the Uncertain Variable dialog is exactly what is saved in the formula cell in your worksheet.
You can drag and drop statistics and risk measures from Risk Solver's Ribbon dropdown galleries to create summary results for your uncertain functions on the worksheet. As with uncertain variables, all of the information for these summary results is stored in PSI Statistics function calls, in ordinary formula cells on your worksheet. Here, too, there is no "hidden information," and all summary results are instantly updated each time you run a simulation.
You can work with any Risk Solver function in a cell formula, using Excel formula editing on the worksheet. You can also use Excel's Function Wizard to help you fill in the arguments of any Risk Solver function.
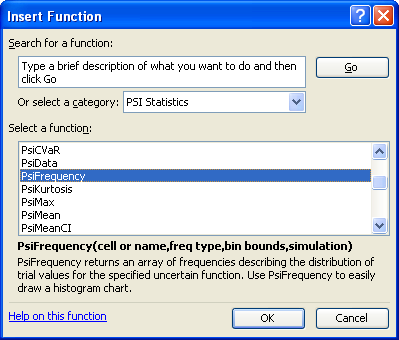
A very useful function in custom applications is PsiFrequency(), which returns the frequencies or "bin counts" for the values of an uncertain function during a simulation. In just a few seconds with the Excel Chart Wizard, you can create a bar chart on the worksheet that reflects the same information as Risk Solver's Uncertain Function dialog Frequency chart. You can specify the number and sizes of bins in the arguments to PsiFrequency(), and you can customize the Excel chart's colors, titles, gridlines, legends and more.
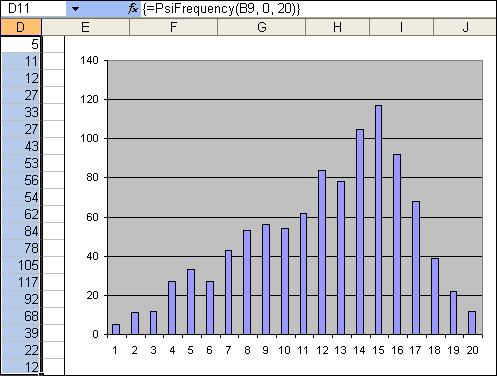
Like a Risk Solver chart, an Excel chart will instantly update whenever you change a number on the spreadsheet, when Interactive Simulation is activated. And such a chart -- unlike a Risk Solver chart -- is embedded in your Excel workbook, so it is distributed to your end users as part of your application. You don't need an expert programmer to create and deploy a custom application with Risk Solver -- you can do it yourself, using your Excel skills and Risk Solver!