This example describes the use of the Bar Chart in Analytic Solver to illustrate the details of the Sports TV Ratings dataset.
Using Analytic Solver Desktop to Create a Bar Chart
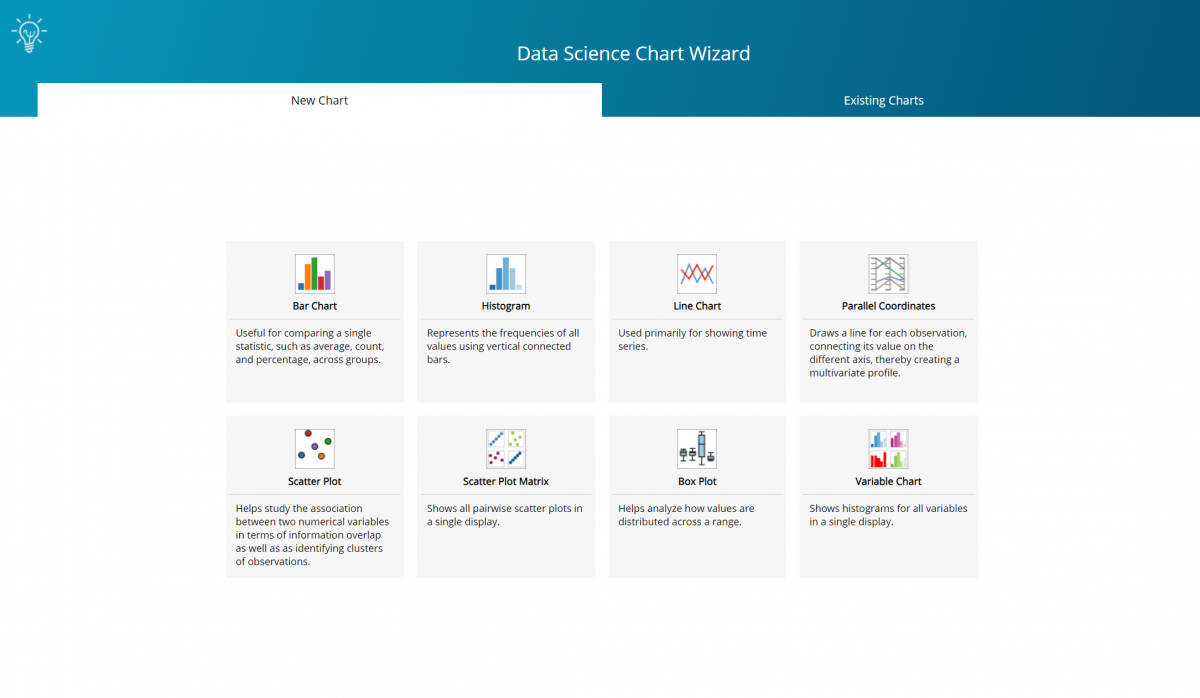
This example illustrates how easy it is to create a chart using the chart wizard. This example creates a chart bar chart but any chart can be created using the same steps. See below for examples for each chart type.
Click Help – Example Models on the Data Science ribbon, then click Forecasting / Data Science Models and open the example file, SportsTVRatings.xlsx.
Select a cell within the data (say A2), then click Explore – Chart Wizard to bring up the first dialog of the Chart Wizard.
Note: When a single cell is selected that is located inside or adjacent to a dataset, the entire dataset will be used for the “Data” cell range. If the user has selected multiple cells in a single rectangular region, those cells, excluding any bounding empty cells, will be used for the “Data” cell range. This behavior was added to allow users to create a chart on a subset of a worksheet dataset without the User being forced to edit the Data address after the chart has been created.
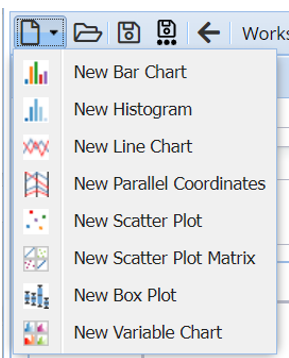
Select Bar Chart on the New Chart tab.
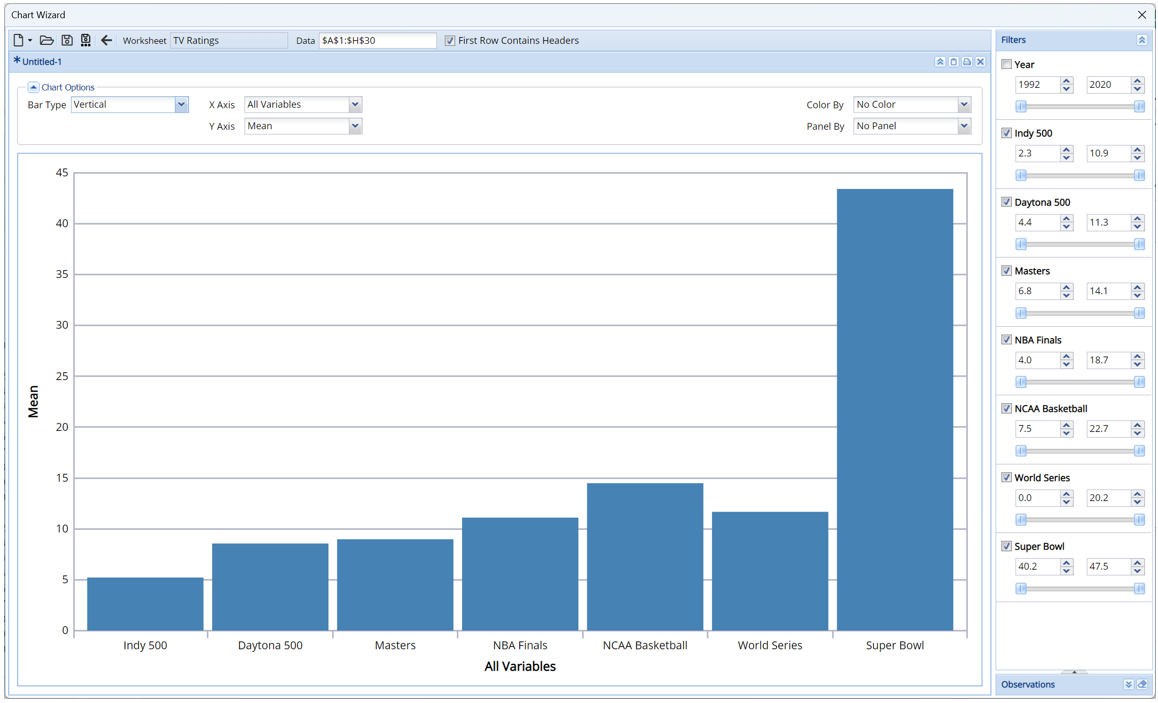
Note: Since the variable Year is not a descriptive metric, uncheck “Year”, in the Filters pane, to remove the Year from the chart.
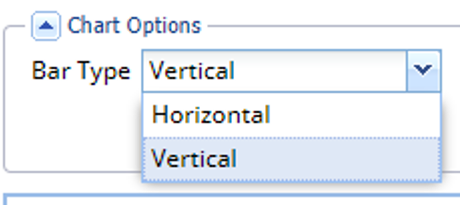
- To change the chart to a horizontal bar chart, click the down arrow next to Bar Type and select Horizontal.
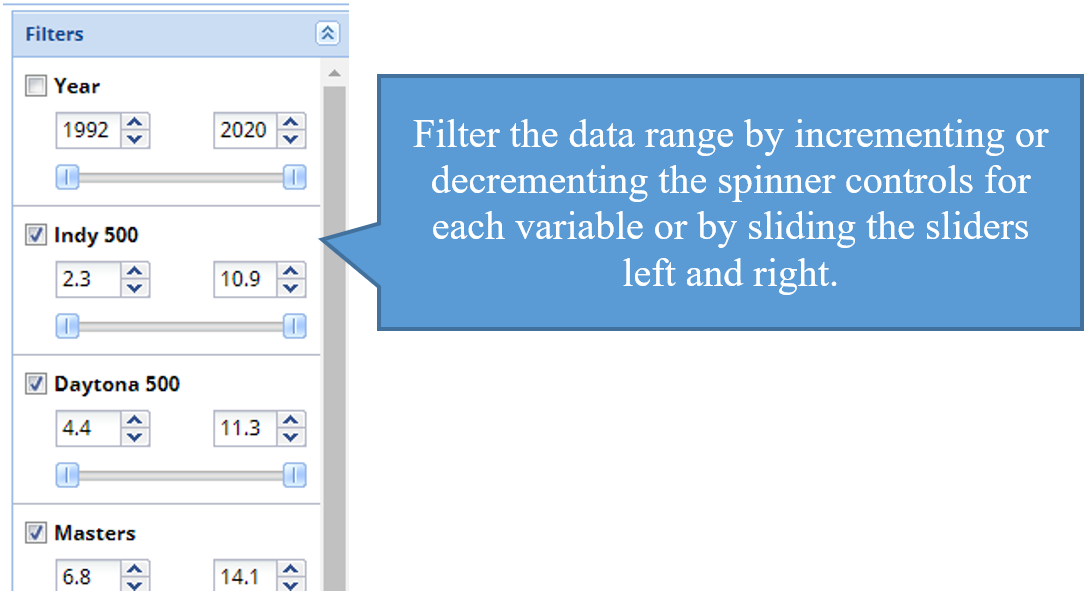
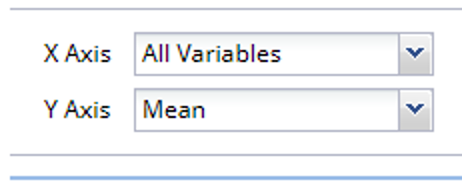
- To change the variables plotted on the X Axis, use the Filters pane. Uncheck the variable to remove from the chart. Select to include in the chart. The data range may be altered by clicking the up an down buttons on the spinner fields or by moving the sliders left (to decrement) or right (to increment). On charts that explicitly include the variable tag field, use these tags to add to or remove variables from the chart. For more information on the tag field, see below.
- To change the plotted metric on the Y Axis, click the down arrow next to Y Axis.
- To add a 2nd chart to the window, simply click the New Chart icon at the top, left of the dialog.
- To save the chart, click the Save icon on the top, left of the dialog.

- To open an existing chart, click the open file icon.

- Click the File Open icon to open the chart and the Trash icon to delete the chart.
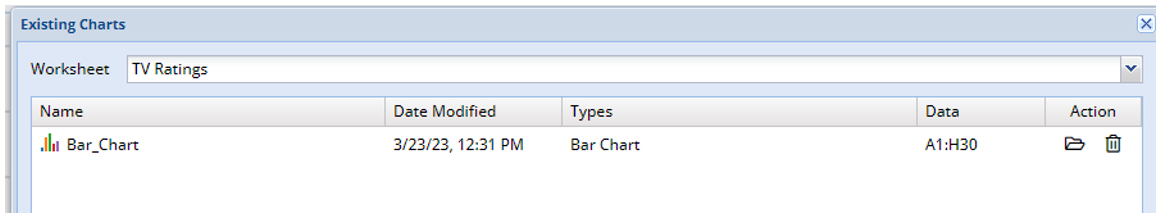
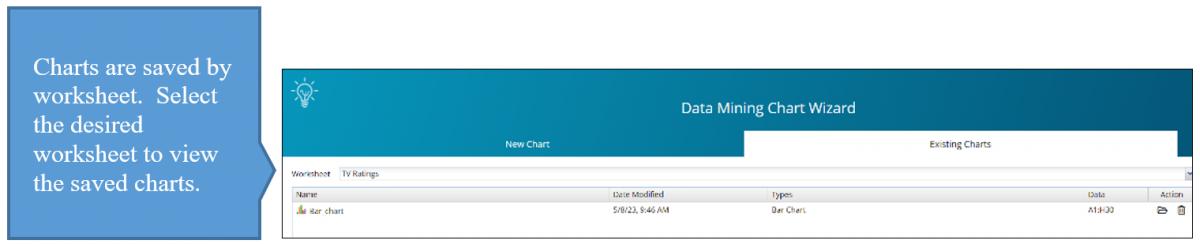
- You can also open an existing chart by clicking the Existing Charts tab on the opening screen of the Chart Wizard.
- Click the back arrow to go back to the chart type selection dialog. Note that the current chart will be lost if not saved.
- Chart changes are tracked. Show confirm dialogs will be displayed when going back, closing or opening an existing chart when the current chart has been changed. The chart title will display an * when unsaved changes have been applied to the chart.
- Use the Data field to control which data to include in the chart.
- First Row Contains Headers is selected by default. This option should be selected if the first row in the data range contains column headings.
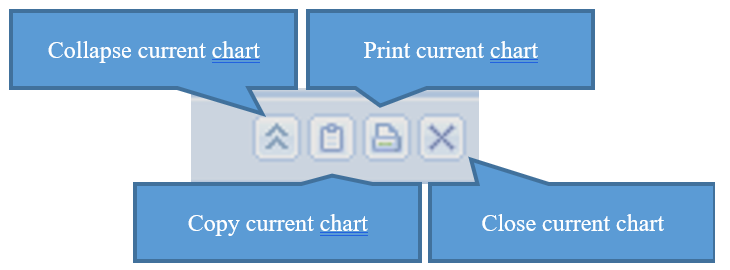
- Use the icons on the top right of the chart to:
- Collapse the current chart.
- Copy the current chart to the clipboard. Note: Mozilla’s Firefox web browser uses a default configuration that does not allow images to be copied to the clipboard. This configuration may be changed by navigating to about:config, within Firefox, and setting dom.events.asyncClipboard.clipboardItem to True.
-
Sent the current chart to the printer. Note: If using Mozilla’s Firefox web browser, “Print backgrounds” must be selected in the Print Options pane, as shown in the screenshot below.
-
Close the current chart window.
- To exit the graph, click the X in the upper right hand corner of the Chart Wizard window.
- Note: Categorical variables are variables with less than or equal to 12 unique values.