See Exporting RASON Results to Excel for information on exporting model results to an Excel workbook.
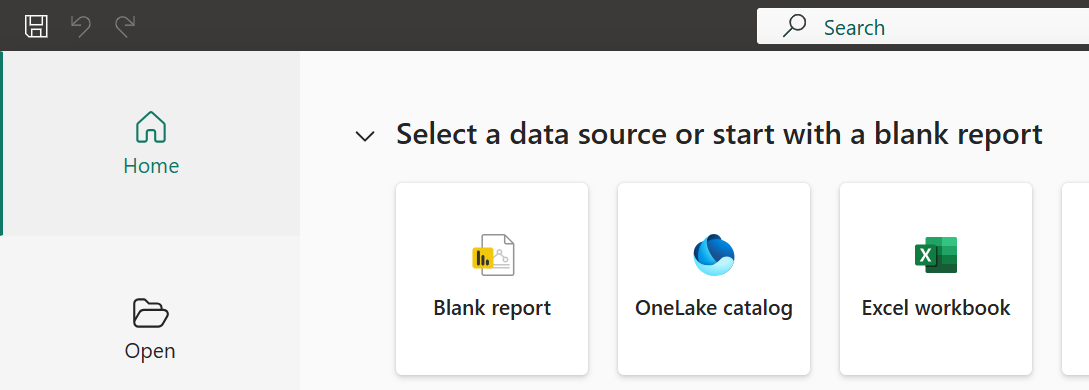
Step 8: Open Power BI Desktop
Launch Microsoft Power BI Desktop and ensure that an instance of Power BI is running. Power BI must be open in order to export results.
Figure 9: Opening Blank Report in Power BI Desktop
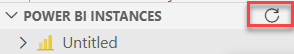
Step 9: Refresh Sources in RASON Desktop Extension
Return to Visual Studio Code and the RASON Desktop extension and click the Refresh icon under Power BI Instances. Since a Blank Power BI Report was opened in Step 8, the Power BI Instance is labeled as “Untitled”. At least one Power BI Instance must be available to receive the export.
Figure 10: Refreshing Sources in RASON Desktop Extension.
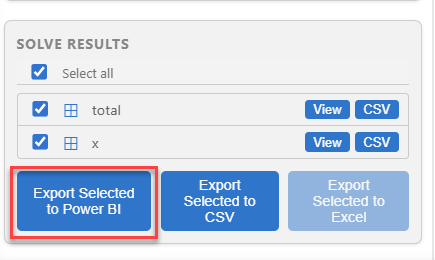
Step 10: Export Results to Power BI
After solving the model in Visual Studio Code, the results can be exported to Power BI for visualization and analysis. This allows you to view and present the optimal solution using Power BI tables, charts, and other report elements. Under Solver Results in the RASON Console, select the results to export, in this case total (the final objective function value) and the x array (the number of each product to manufacture), then click, Export Selected to Power BI.
Figure 11: Exporting model results to Power BI.
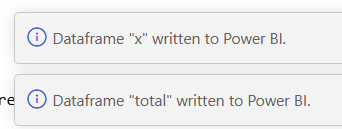
Notice in the bottom right corner, messages indicating the export was successful.
Figure 12: Export successful.
Step 11: Viewing Exported Results in Power BI
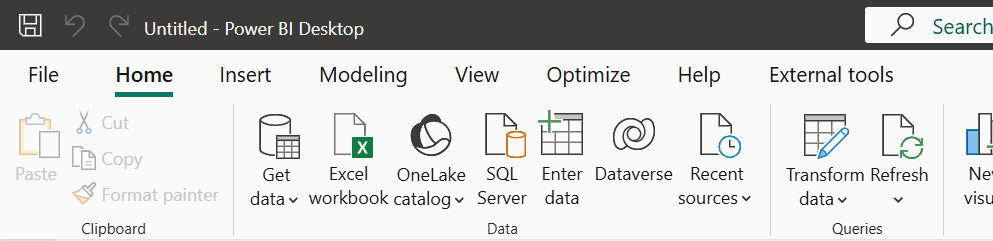
After exporting results from RASON Desktop extension, switch to Power BI Desktop to view the imported data. Click refresh on the Home tab.
Figure 13: Click Refresh on Power BI Home tab
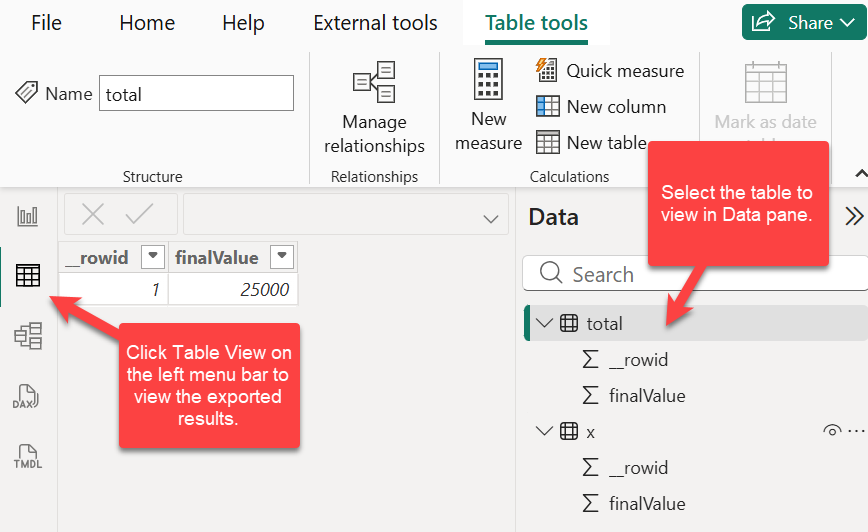
The exported results are added to the report as tables. Click Table View on the left menu and then select the Table to view in the Data pane.
Figure 14: Tables containing exported objective function value (total) and exported decision variable values (x).
These results can be further explored using charts and other Power BI visuals to better understand the model’s output and communicate insights.
Next: Export the Entire RASON Model to Power BI
Continue to the next topic to export the full ProductMix4 RASON model to a Power BI report, so the model can be run and reviewed directly from Power BI.