Can you work with Big Data in Excel? From the barrage of recent news, white papers, and sales calls about Big Data, you would think not. A common theme is that “spreadsheets can’t handle Big Data and advanced analytics,” and that companies need to “move up” to new tools, that the vendors with the white papers offer -- implicitly, the benefits outweigh the expense and steep learning curve.
But what if you could work with Big Data in Excel? It turns out that you can, using the classic tool of (statistically representative) sampling. A recent blog post from Frontline Systems shows how you can do this with Analytic Solver Data Mining. It studies the same airline Big Data dataset used in an online tutorial by HortonWorks, one of the best-known Big Data firms. This 120 million record dataset covers all commercial flights within the USA dating from October 1987 to April 2008 -- 29 commercial airlines and 3,376 airports, including 3.2 million cancelled flights and 25 million flights at least 15 minutes late.
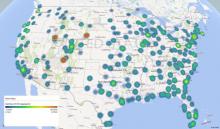
Summarizing 120 Million Records
The post shows how you can quickly summarize results across 120 million records -- "point and click" -- instead of writing lambda function code in Python (in the HortonWorks tutorial) -- by performing an aggregation query against the data in Frontline's Apache Spark Big Data cluster on Amazon Web Services, to obtain the average delays for 341 airports, aggregated over the 22-year period 1987-2008, as an Excel "data table". Farmington, New Mexico seems to have the longest delays. That data table was used to create the visualization above, using Microsoft Power Map.
Sampling Big Data
Where the HortonWorks tutorial simplified matters by restricting the data to flights originating from Chicago's O'Hare airport, Frontline's analysis covers all 3,376 airports -- it uses a simple menu selection, Get Data - Big Data - Sample, to draw a statistically representative random sample of about 100,000 records from the Apache Spark cluster. Like HortonWorks, the post partitions the data into a training set from 2007 flights, and a validation set from 2008 flights.
Logistic Regression
Applying logistic regression over 100,000 records to obtain a "binary classifier" -- using data about each flight to predict whether or not it was delayed -- takes a fraction of a second in Analytic Solver Data Mining. Comparing results with Iteration 1 of the HortonWorks study, the model has essentially equivalent Recall (ratio of true positives, 0.64) and Accuracy (59%), even though it used less than 0.1% of the total data in the dataset.
Feature Selection and Simplification
The post goes further, using Feature Selection to ask “Are all the variables in the airline dataset really important? Which ones provide useful information about the possible delay of a flight?” A quick visualization shows that the scheduled departure and scheduled arrival times have the strongest correspondence with departure delays, according to Welch’s test. And this leads to a model that confirms frequent airline travelers' anecdotal experience: time of day really matters. An 8-variable logistic regression model has Recall=0.64, Accuracy=59%, but a simple 1-variable model using time of day has Recall=0.63, Accuracy=59%.
Does Big Data Break Excel?
The post quotes Brian Wilts, Senior Data Scientist at Jawbone: "The joke is that big data is data that breaks Excel -- but we try not to be snooty about whether you measure your data in MBs or PBs. Data is more about your team and the results they can get," and says: "We couldn't agree more. It IS about your team -- including your business analysts, as well as your data scientists -- and the results they can get. Our aim is to make life easier for the business analysts!"