The RASONRunnerSetup.exe installer must be run first to add RASON Solve under External Tools in Microsoft Power BI and add the RASON tab in Microsoft Excel. See the previous chapter on installation for more information on how to install RASON Runner.
Step 12: Exporting Model to Power BI to be solved in Power BI.
While exporting results allows you to visualize a solved model, RASON Desktop also enables you to export the full model to Power BI, where it can be executed directly within a Power BI report. This distinction is important: exporting results provides a static snapshot of a completed simulation, while exporting the model allows the simulation to be re-run inside Power BI with different inputs.
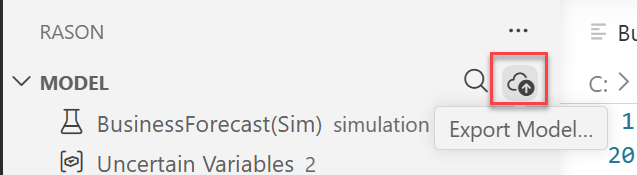
To export a model to Power BI, return to the RASON Desktop extension in Visual Studio Code, select the BusinessForecast.json tab and click the Export Model to Power BI button in the Visual Studio Code interface.
Figure 15: Export RASON Model to Power BI
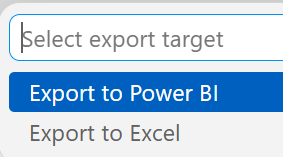
At the top of the screen, select Export to Power BI.
Figure 16: Click Export to Power BI
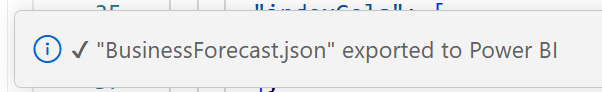
Notice the message indicating the model export was successful.
Figure 17: Model export successful.
Once exported, the model can be executed directly within Power BI, allowing users to analyze results and explore different scenarios within Power BI.
Step 13: Solve the model in Power BI
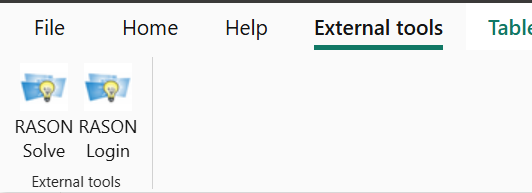
Click Refresh, to refresh the tables and then click External Tools – Solve. The simulation is executed again, generating updated trial and summary results for all outputs.
Figure 18: Click External Tools - Solve to run the simulation model
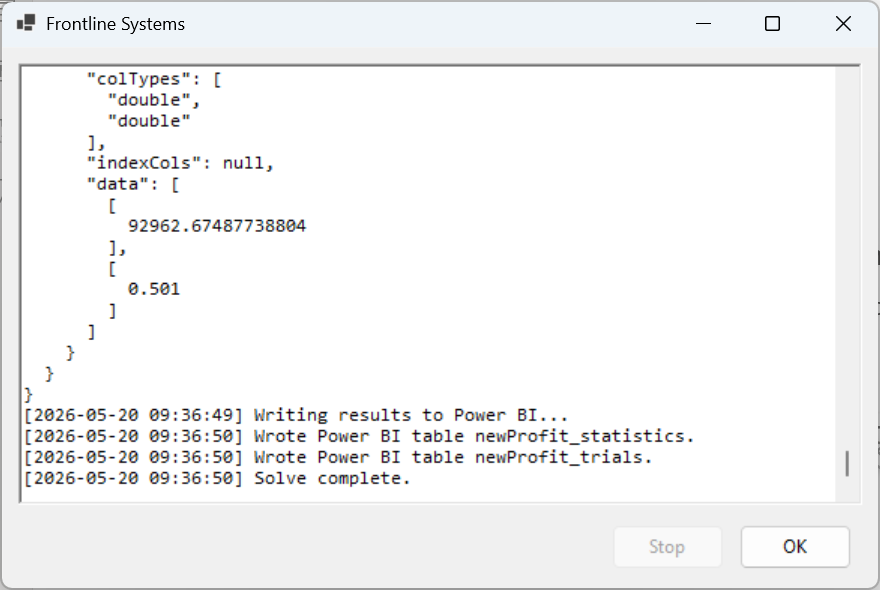
A message indicating the simulation is in progress will appear. When the model is executed in RASON Runner, the simulation is performed on the RASON.net server. The model and its associated data are sent to the server, where the simulation is carried out, and the results are then returned to Power BI for display.
Figure 19: Solver Message
Step 14: Viewing Exported Results in Power BI (Tables)
Once the solving process has completed, a refresh may be required to update both tables.
After executing the model in Power BI, the updated tables reflect the results returned from the RASON.net server. These results can be further explored using Power BI visuals to better understand the distribution of outcomes and the impact of uncertainty on business performance.”
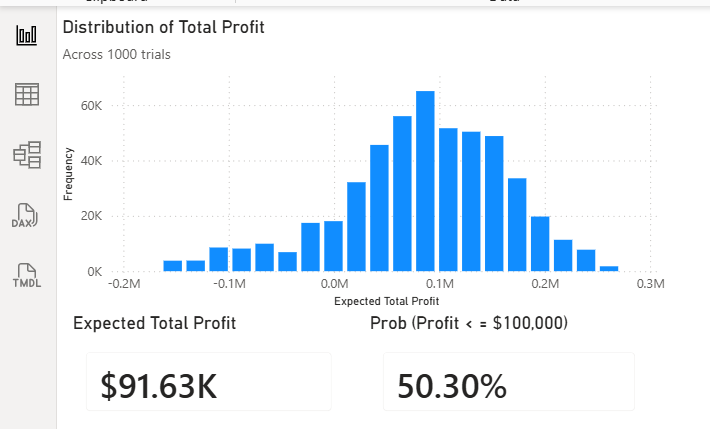
A simple Power BI visual is shown in the figure below, displaying a histogram generated from the trial values for the uncertain function, newProfit, as well as the expected value for newProfit and the probability that newProfit will be less than $100,000. Each bar in the histogram represents the frequency of outcomes across simulation trials.
Figure 20: Simple Power BI Visuals
This example demonstrates the complete workflow of developing a model in RASON, exporting it to Power BI using RASON Desktop, and executing it within a report. The results returned from the RASON.net server can be viewed and analyzed directly in Power BI, enabling users to integrate simulation models into their reporting and decision-making processes, without the need for Visual Studio Code.
Next: Export Simulation results to Excel
Continue to the next topic to see how to export the simulation results to Microsoft Excel.