In the latest release of Analytic Solver, users now have access to the Analyze Data feature located on the Explore menu. With the Analyze Data application, users can generate a multivariate chart for any number of scale (continuous) or categorical variables. This feature can be used as a standalone application and can be particularly useful as a step in understanding your data while in the process of building your data mining model. This feature allows you to look at your data not as static historical data but as a realization of an uncertain variable such as what you would encounter in simulation modeling.
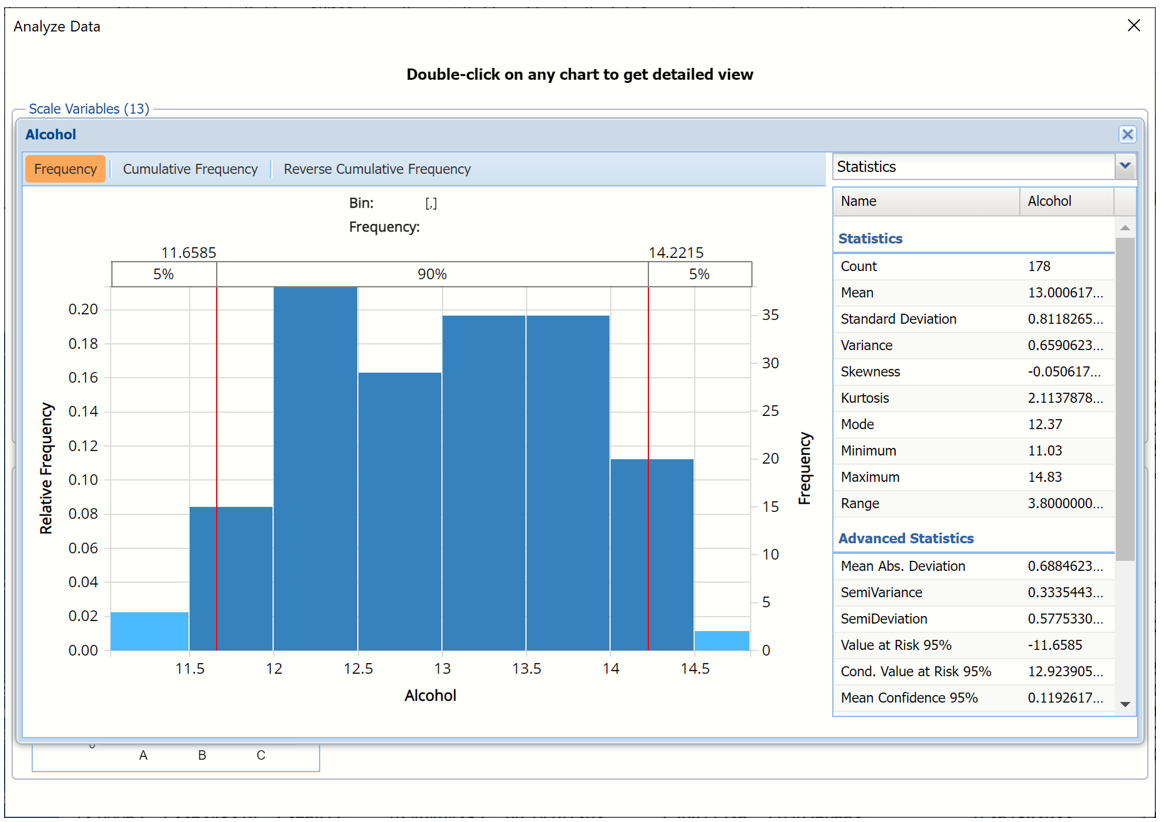
Double-clicking the preview chart will display a detailed view of a histogram for scale (continuous) variables and bar charts for categorical variables, allowing users to view their data from a frequency perspective, such as a historical sample from a possible probability distribution. Various statistics pertaining to each variable’s range of values are displayed on the right, such as count, mean, standard deviation, etc.
Detailed view for the Alcohol scale (continuous) variable