Descriptions of each option features in the Analyze Data application may be found below.
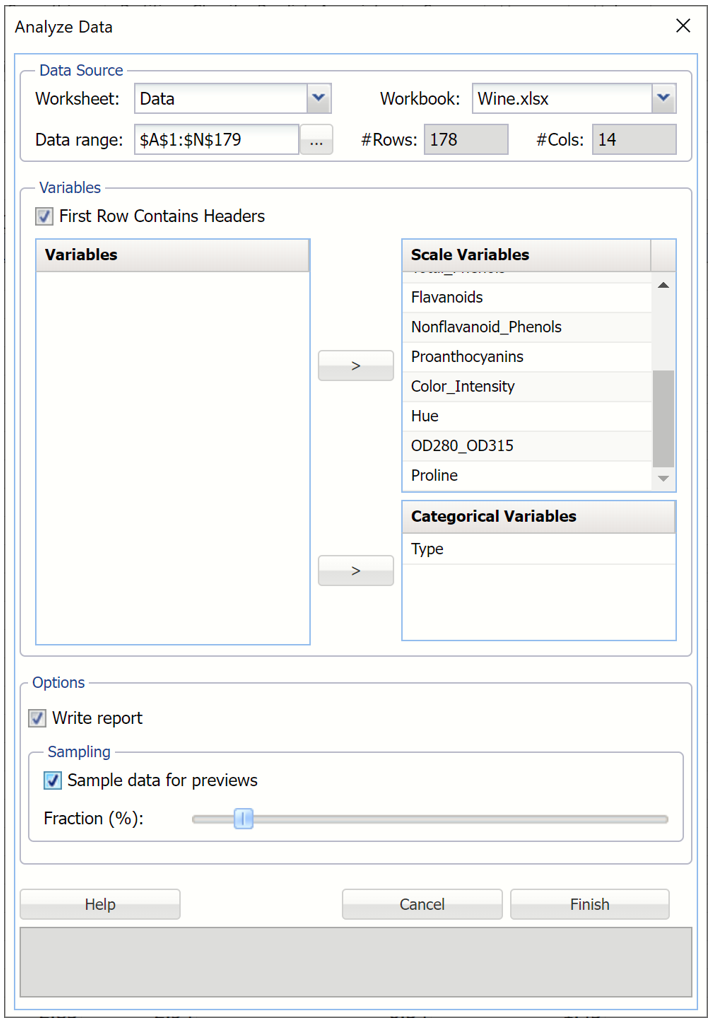
Data Source: This portion of the dialog includes data relevant to the data source such as the Worksheet name, the Workbook name, the Data range in the worksheet and the number of rows and columns in the data range.
Variables: Select the variable(s) to be included in the data analysis under Variables, then click the arrow to move the variable to either Scale Variables or Categorical Variables, depending on the type of variable selected.
Options: Write Report
If Write report is selected, Analytic Solver Data Science will insert a report containing all statistics in the detailed chart dialog. This includes all Statistics, Percentiles and Six Sigma indices. (The Statistics worksheet will be inserted to the right of the Data tab.) If this checkbox is left unchecked, no report will be inserted into the workbook. The preview dialog will be displayed, and detailed charts will be available if double-clicked. Once the dialog is closed, it will not persist in the workbook. (The application would have to be re-run to re-open the chart.)
Options: Sample data for previews and Fraction %
If the worksheet contains an extremely large dataset, users can select Sample data for previews and use the Fraction % slider to limit the amount of data utilized when creating the chart previews. This option has no bearing on the amount of data included in the detailed charts. Detailed charts always use the full amount of data to produce the interactive chart and statistics. The Fraction % may be changed after the report is created by editing the Sample for chart previews cell. For more information see below.