The Descriptive Statistics tool in the XLMiner Analysis Toolpak calculates descriptive statistics for a dataset.
The generated statistics are:
- Mean
- Standard Error
- Median
- Mode
- Standard Deviation
- Sample Variance
- Kurtosis
- Skewness
- Range
- Minimum
- Maximum
- Sum
- Count
The example dataset below shows monthly TV Sales for a small appliance store.

To generate the statistics:
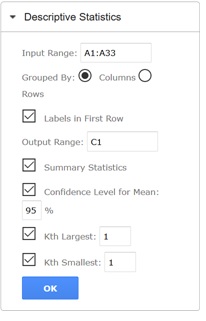
- On the XLMiner Analysis ToolPak pane, click Descriptive Statistics.
- Click the Input Range field and then select cells A1:A33 in the spreadsheet.
- Keep "Columns" selected for "Grouped by".
- Leave "Labels in First Row" selected since the first row in the data range includes the column labels.
- Click the Output Range field and then select cell C1
- Keep "Summary Statistics", "Confidence Level for Mean", "Kth Largest", and "Kth Smallest" at their defaults.
- Summary Statistics: When selected, this tool will generate the following statistics:
- Mean
- Standard Deviation
- Median
- Mode
- Standard Error
- Sample Variance
- Kurtosis
- Skewness
- Range
- Minimum
- Maximum
- Sum
- Count
- Confidence Level for Mean: When selected, the Confidence Level for the Mean of the dataset will be calculated.
- Kth Largest: Select to display the Kth largest value, i.e, if 3 is entered, the 3rd largest value will be displayed.
- Kth Smallest: Select to display the Kth smallest value, i.e., if 4 is entered, the 4th smallest value will be displayed.
7. Click OK.

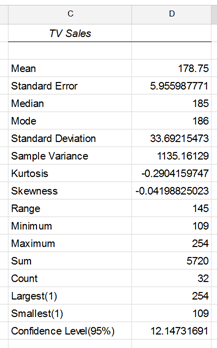
The results are shown below.

