This example describes the steps required to create a classification model using the Discriminant Analysis classification algorithm and then uses that model to score new data. Note that this is only supported in Analytic Solver Desktop. This is not supported in the Data Science Cloud app.
The example dataset Boston_Housing.xlsx will be used to illustrate the steps required. Recall that this example dataset includes 14 variables related to housing prices collected from census tracts in the Boston area. For more information on this example dataset and Discriminant Analysis in general, please see Discriminant Analysis.
Open Boston_Housing.xlsx, then click Classify – Discriminant Analysis to open the Discriminant Analysis – Data tab.
Select the CAT. MEDV variable in the Scale Variables In Input Data list box then click > to select as the Output Variable. Immediately, the options for Classes in the Output Variable are enabled. #Classes is prefilled as “2” since the CAT. MEDV variable contains two classes, 0 and 1.
“Success” Class (for Lift Chart) is selected by default and Class 1 is to be considered a “success” or the significant class in the Lift Chart. (Note: This option is enabled when the number of classes in the output variable is equal to 2.)
Enter a value between 0 and 1 here to denote the Specify initial cutoff probability for success. If the calculated probability for success for an observation is greater than or equal to this value, than a “success” (or a 1) will be predicted for that observation. If the calculated probability for success for an observation is less than this value, then a “non-success” (or a 0) will be predicted for that observation. The default value is 0.5. (Note: This option is only enabled when the # of classes is equal to 2.)
Select CRIM, ZN, INDUS, NOX, RM, AGE, DIS, RAD, TAX, PTRATIO, & B in the Scale Variables In Input Data list box then click > to move to the Selected Variables list box. (CHAS, LSTAT, & MEDV should remain in the Scale Variables In Input Data list box as shown below.)

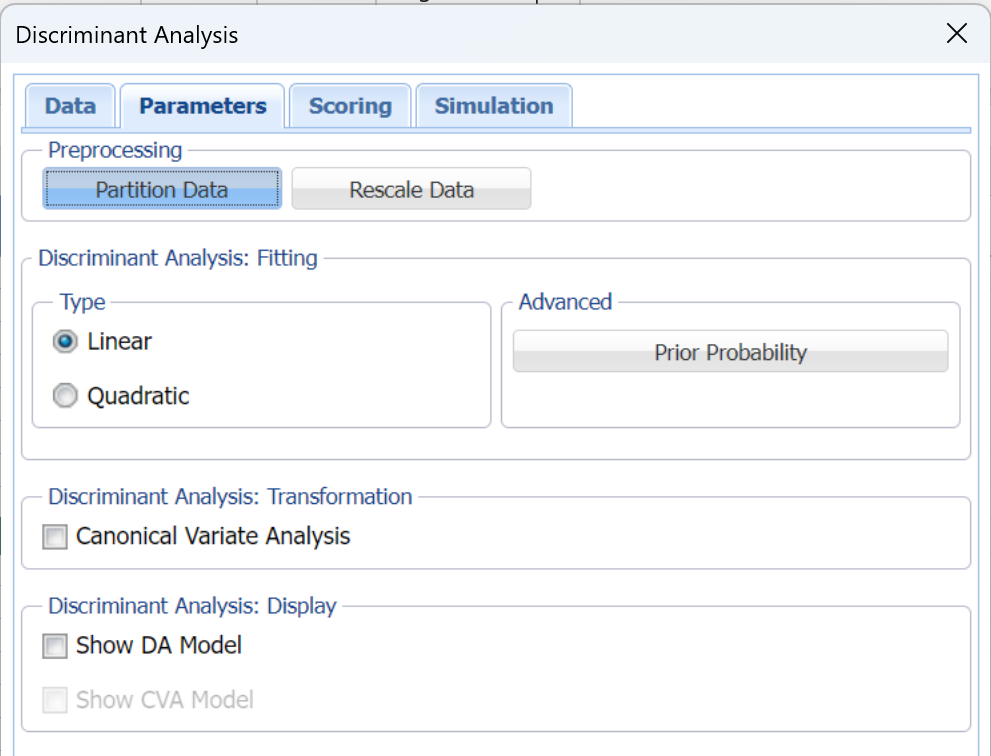
Click Next to advance to the Parameters tab.
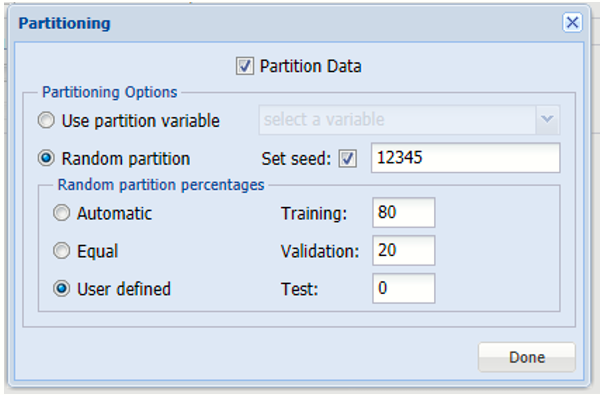
Since we did not partition the dataset before we started the classification method, we can partition the dataset now. Click Partition Data and then select the Partition Data option to enable the Partitioning Options. Select User Defined, then enter 80 for Training and ensure that 20 is automatically entered for Validation. Click Done to close the dialog.
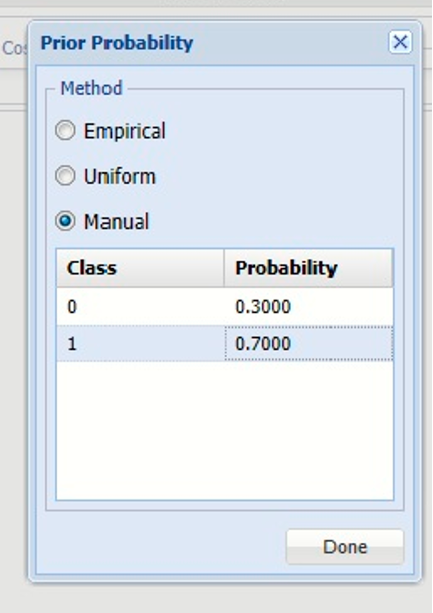
Click Prior Probability to open the Prior Probability dialog. Three options appear: Empirical, Uniform, and Manual.
If the first option is selected, Empirical, Analytic Solver Data Science will assume that the probability of encountering a particular class in the dataset is the same as the frequency with which it occurs in the training data.
If the second option is selected, Uniform, Analytic Solver Data Science will assume that all classes occur with equal probability.
Select the third option, Manual, to manually enter the desired probability value for each class.
Under Probability, enter 0.7 for Class 1 and 0.3 for Class 0. Click Done to close the dialog.
Click Next to advance to the Discriminant Analysis – Scoring tab.
Since we did not create a test partition, the options for Score test data are disabled. See the help topic, Data Science Partitioning, for information on how to create a test partition.
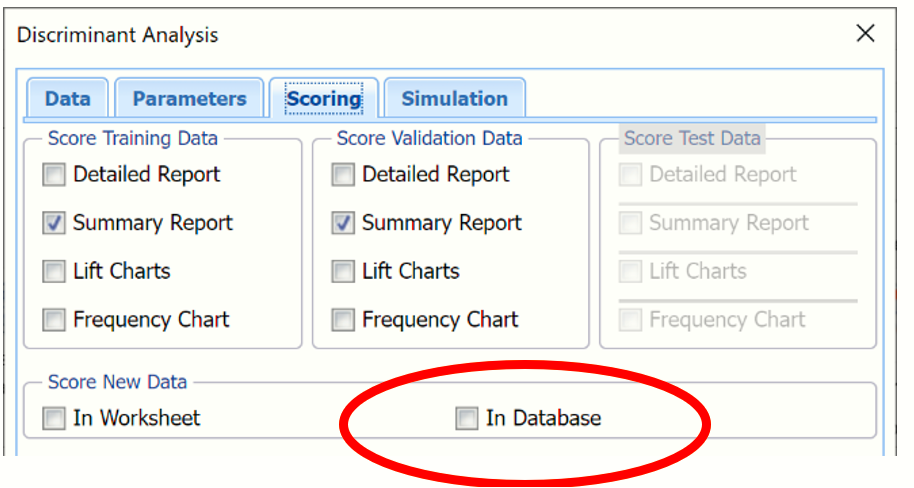
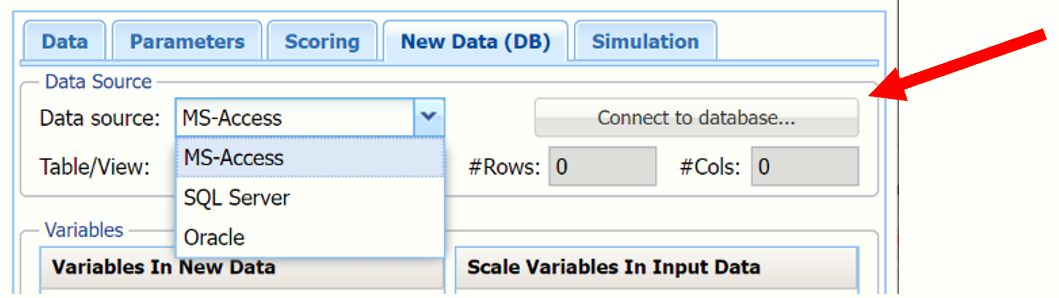
In the Score New Data group, select In Database. The Scoring to Database tab opens.
The first step on this tab is to select the Data source. Once the Data source is selected, Connect to database… will be enabled.
This example illustrates how to score to an MS-Access database. Select MS-Access for the Data source, then click Connect to Database…
An Open dialog appears, browse to the location where dataset.mdb is saved, ...
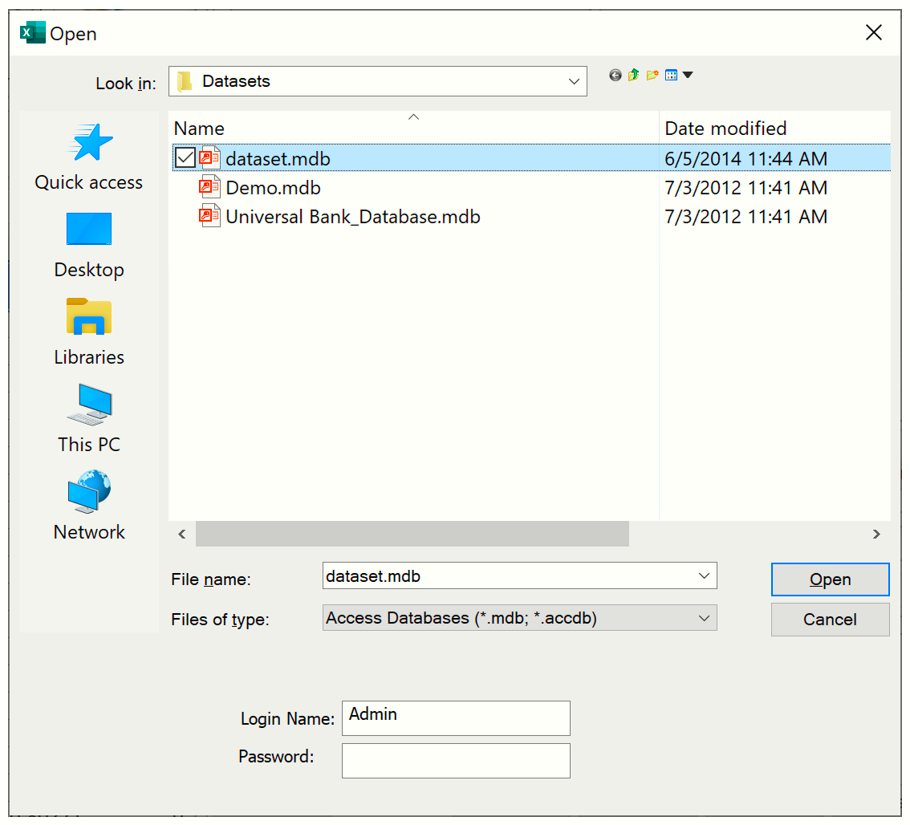
...then click Open. Note the Login Name and Password fields at the bottom of the tab. If your database is password protected, enter the appropriate information here.
The Scoring to Database tab re-appears. Select Boston_Housing for Table/View. This tab will be populated with variables from the database, dataset.mdb, under Variables in New Data and with variables from the Boston_Housing.xlsx dataset under Scale Variables In Input Data.
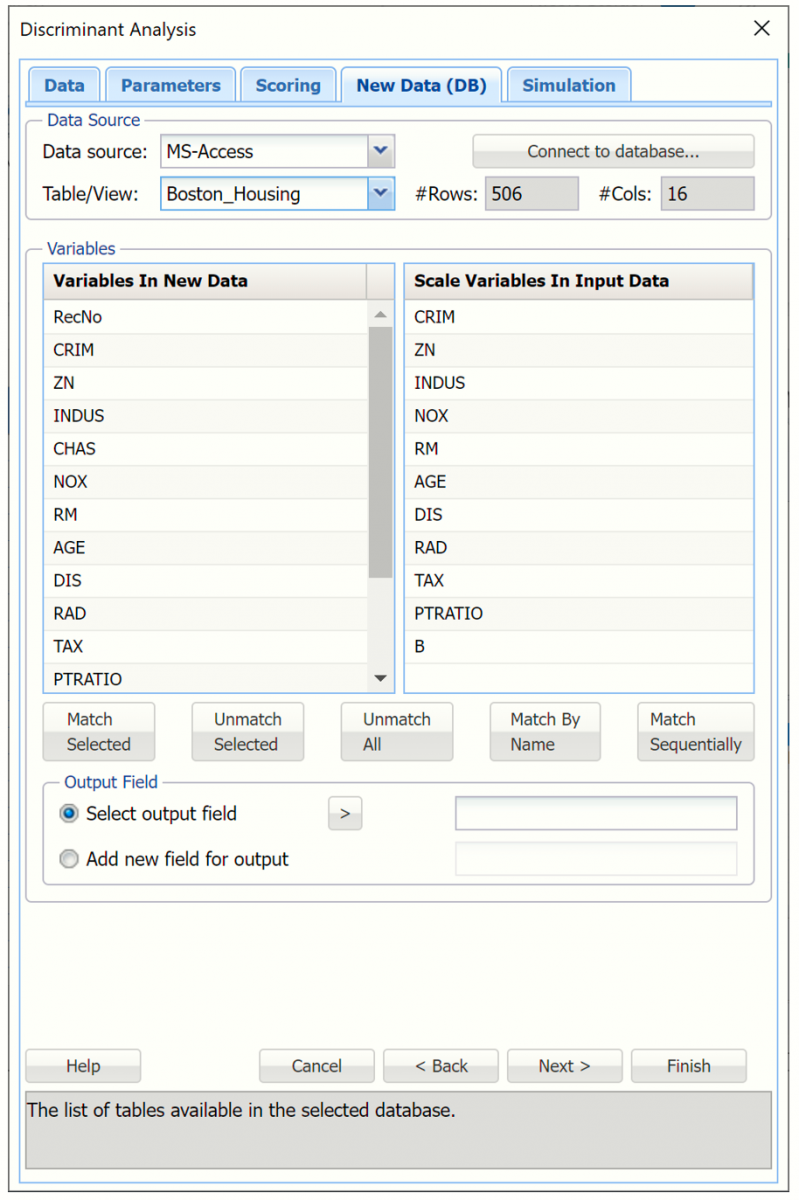
Analytic Solver Data Science offers three easy techniques to match variables in the dataset to variables in the database:
- Matching by Name.
- Matching Sequentially
- Manually Matching.
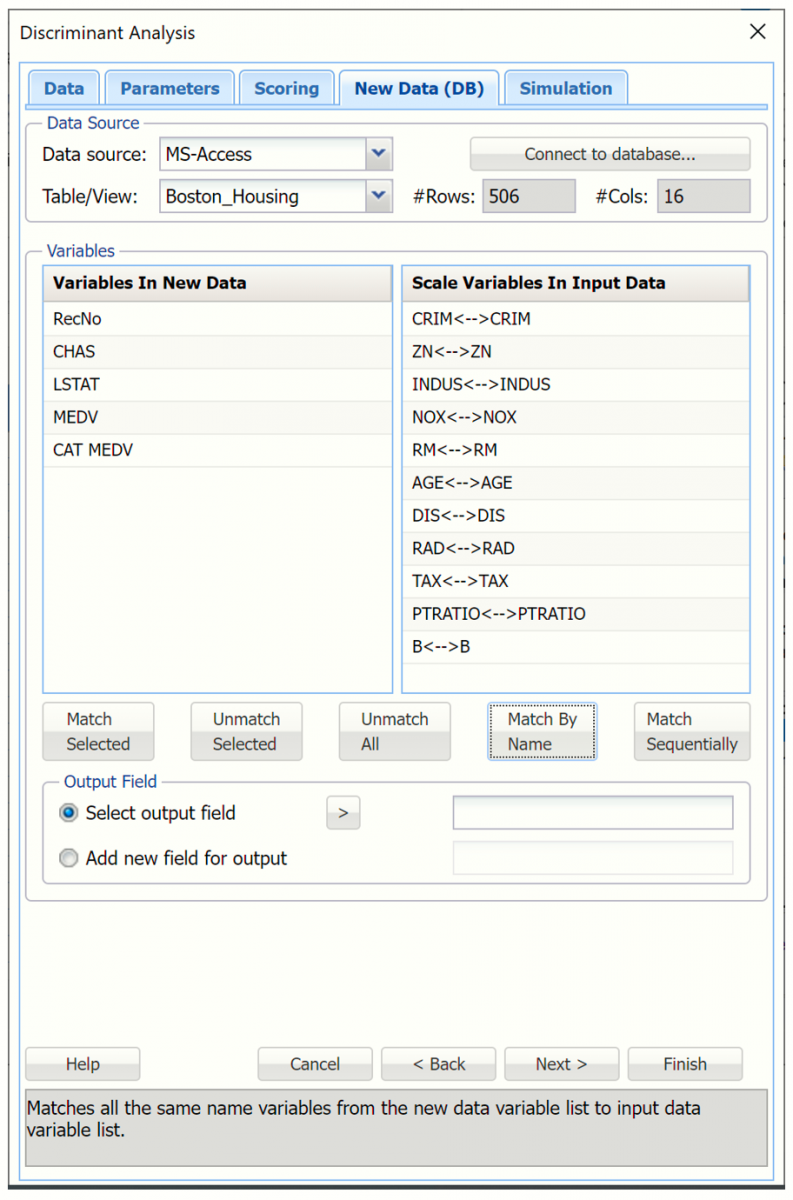
If Match By Name is clicked, all similar named variables in Boston_Housing.xlsx will be matched with similar named variables in dataset.mdb, as shown in the screenprint below. Note that the additional database fields remain in the Variables in New Data list box while all variables in the Scale Variables In Input Data list box have been matched.
If Match Sequentially is clicked, the first 11 variables in Boston_Housing.xlsx will be matched with the first 11 variables in the dataset.mdb database.
The first 11 variables in both the database and the dataset are now matched under Scale Variables In Input Data. The additional database fields remain under Variables in New Data.
Note: It Match Sequentially is clicked, variables from each list are matched in sequence, i.e. 1st variable under Variables in New Data is matched with 1st variable under Scale Variables in Input Data, 2nd variable under Variables in New Data is matched with the 2nd variable under Scale Variables in Input Data, etc.
It’s also possible to start the sequential matching with variables that are not in order in the Variables in New Data list box. For example, if the variables, CRIM, INDUS, and NOX are selected, then Match Sequentially is clicked, the selected database fields (CRIM, INDUS and NOX) will be matched with the first three variables in the Input Data and the remaining Table Fields will be matched sequentially with the remaining Input Data Variables.
To manually map variables from the dataset to the database, select a field from the database in the Variables in New Data list box, then select the variable to be matched in the dataset in the Scale Variables In Input Data list box, then click Match Selected.
For example to match the CRIM variable in the database to the CRIM variable in the dataset, select CRIM from the dataset.mdb database in the Variables in New Data list box, select CRIM from Scale Variables In Input Data, then click Match Selected to match the two variables.
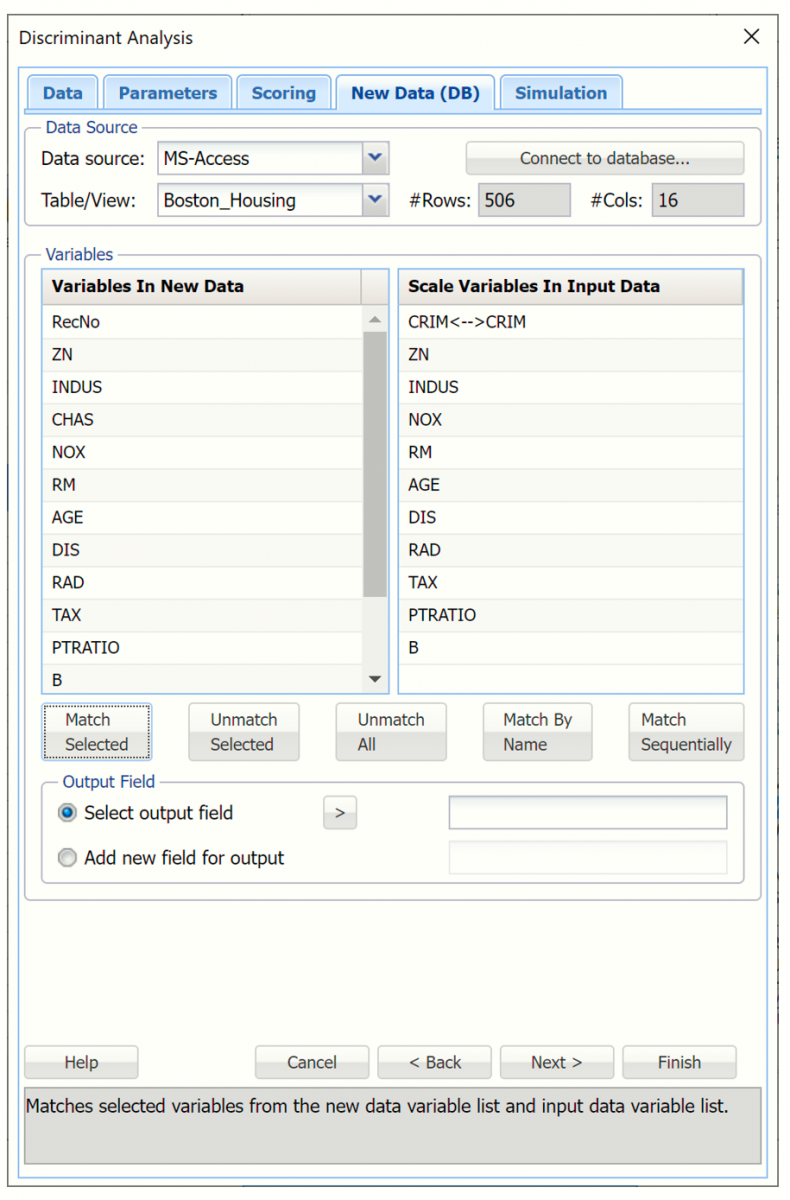
Notice that CRIM has been removed from the Variables in New Data list box and is now listed next to CRIM in the Scale Variables In input data list box. Continue with these steps to match the remaining 10 variables in the Boston_Housing.xlsx dataset.
To unmatch all variables click Unmatch all. To unmatch a single match, highlight the match, then click Unmatch selected.
An Output Field may be selected from the remaining database fields listed under Variables in New Data or a new Output Field can be added. Note: An output field must be a string.
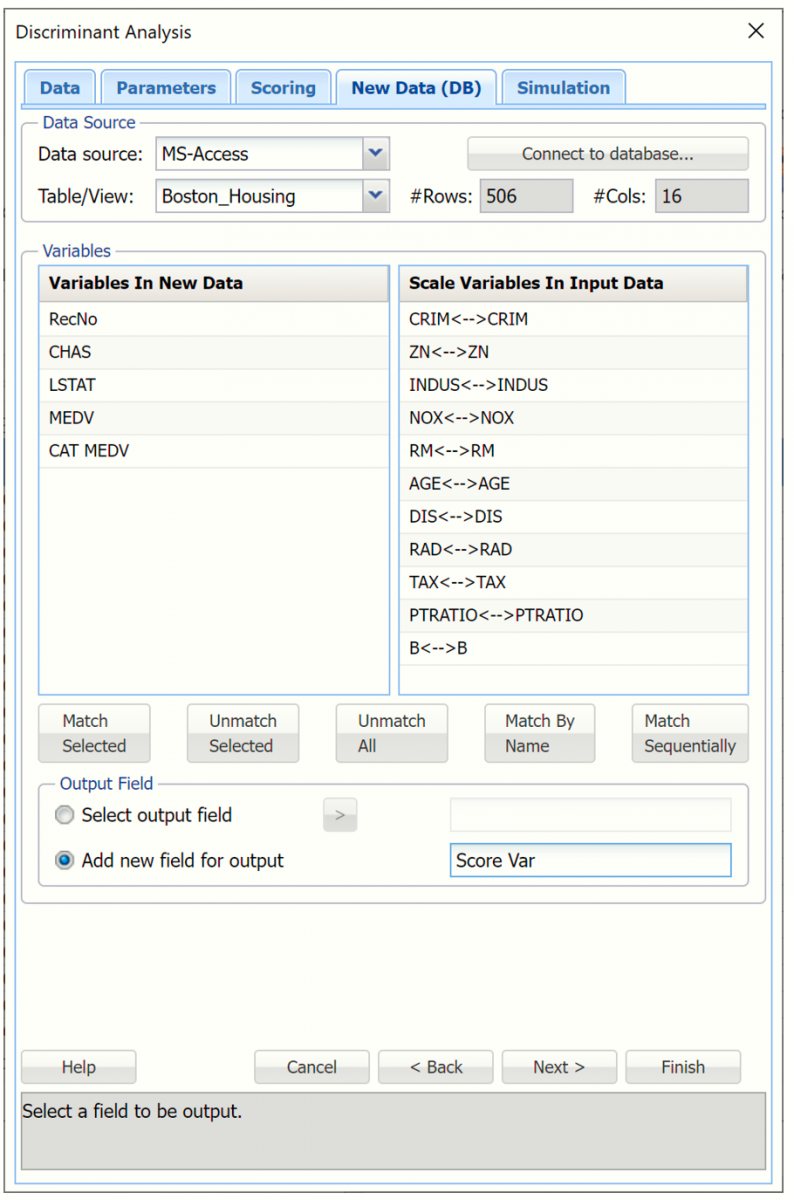
For this example,
- Click Unmatch All,
- Click Match By Name,
- Select Add new field for output,
- Enter a name in the field to the right such as “Score Var”.
From here you can either click Finish to score the new data or you can click Next to advance to the Simulation tab where you can perform a complete risk analysis on the data. See the help topic, Generate Data, for more information on the options displayed on the Simulation tab.
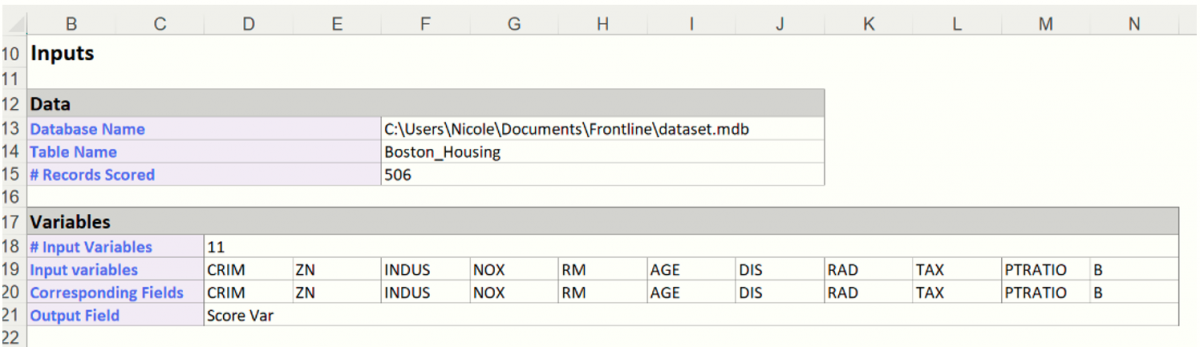
Click Finish on the New Data (DB) tab. The DA_NewScoreDB worksheet is inserted to the right of the Data worksheet. In addition, the worksheet name is also inserted into the Model tab of the Analytic Solver task pane under Reports – Discriminant Analysis. This worksheet simply includes the name of the database, Table Name, # of records scored and the variables.
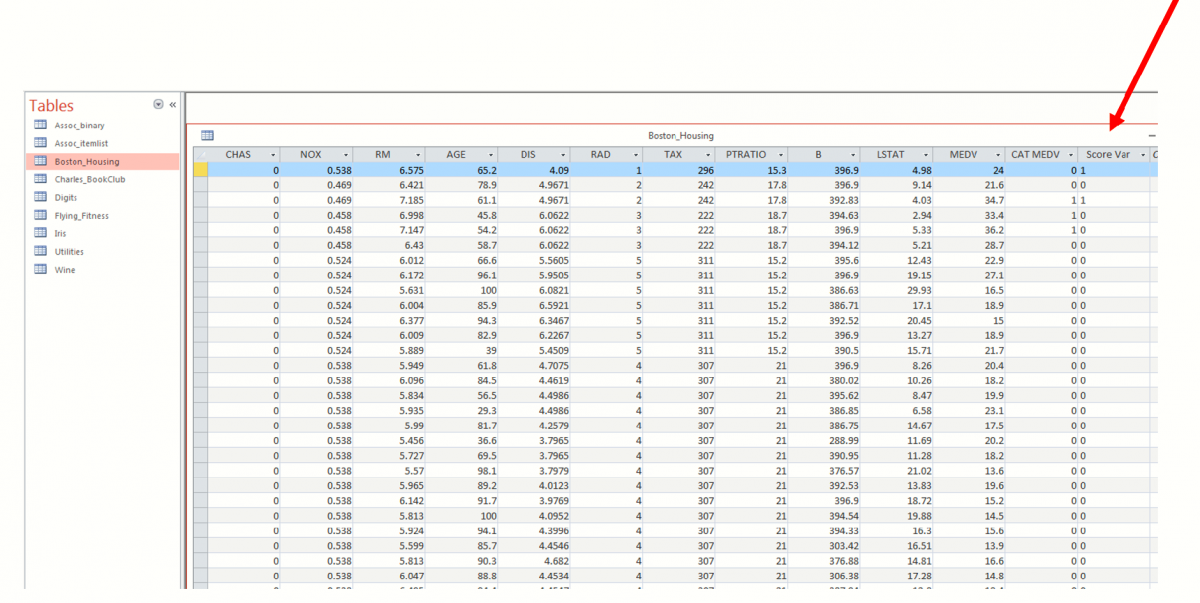
To view the scored records, open the dataset.mdb database in Microsoft Access and inspect the Score Var column as shown in the screenshot below. (Click the Enable Content button to view the dataset.)
Note: If the database is saved in a location that does not allow write-access, you will get the error,[Microsoft][ODBC Microsoft Access Driver] Cannot modify the design of table 'Boston_Housing'. It is in a read-only database.