This example illustrates the use of partitioning with oversampling using Analytic Solver Data Science. Click Help – Example Models on the Data Science ribbon, then Forecasting/Data Science Examples to open the example model, Catalog_multi.xlsx.
This sample dataset contains information associated with the response of a direct mail offer, published by DMEF, the Direct Marketing Educational Foundation. The output variable is Target dependent variable:buyer(yes=1). Since the success rate for the target variable (Target dependent variable:buyer(yes=1)) is less than 1%, the data will be “trained” with a 50% success rate using Analytic Solver Data Science’s oversampling utility.
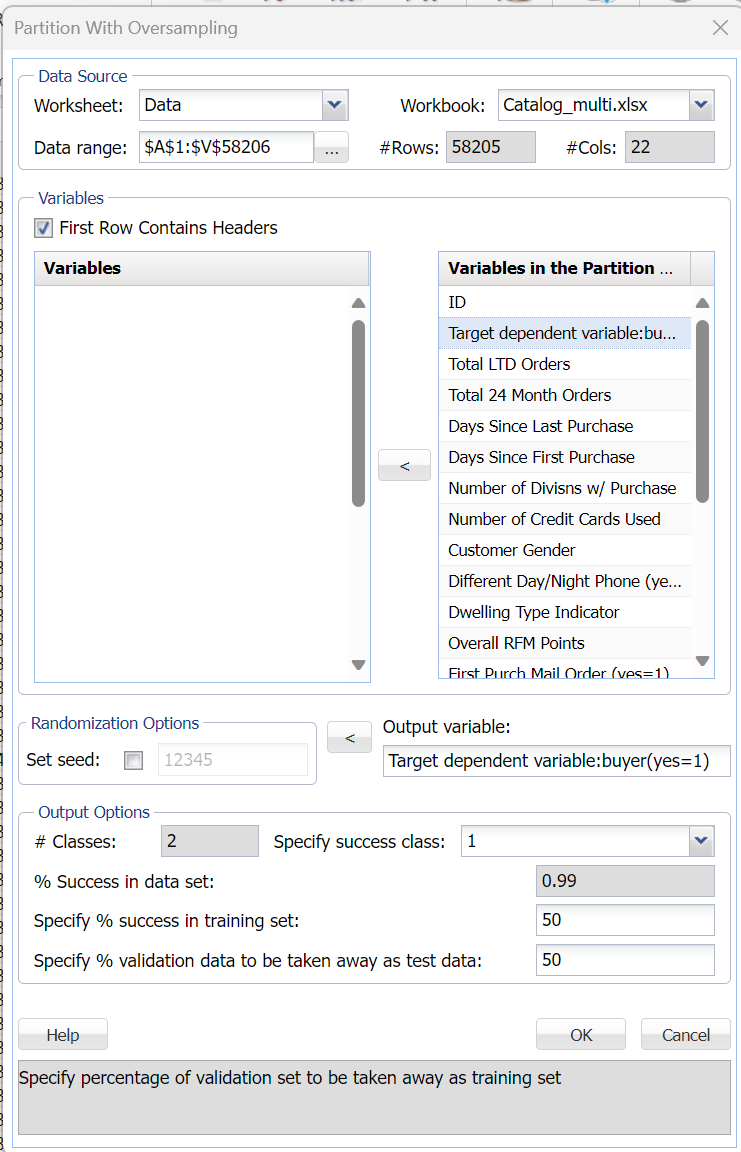
Click Partition – Partition with Oversampling (in the Data Scienc section of the Data Science ribbon) to open the Partition with Oversampling dialog.
First confirm that Data Range at the top of the dialog is displayed as $A$1:$V$58206. If not, simply click in the Data Range field and type the correct range.
Select all variables in the Variables list box then click > to move all variables to the Variables in the Partition Data list box. Afterwards, highlight Target dependent variable: buyer(yes = 1) in the Variables in the Partition Data list box then click the > immediately right of Output variable to designate this variable as the output variable. Reminder: this output variable is limited to two classes, e.g. 0/1 or “yes”/”no”.
Enter 50 for Specify % validation data to be taken away as test data.
The Data_Partition worksheet is inserted to the right of the Data worksheet.
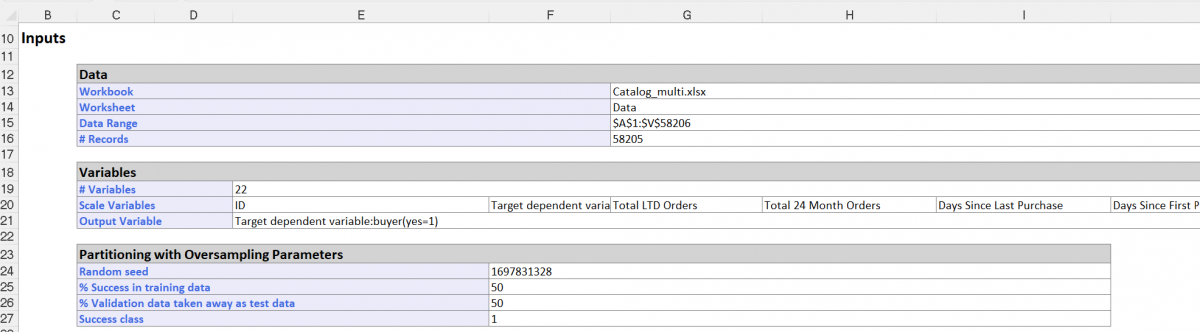
The Output variable (Target dependent variable: buyer (yes = 1)) contains 576 success records or 1s, all of which have been allocated to the Training Set. The percentage of success records in the original data set is 0.009896 or 576/58204 (number of successes/number of total rows in original data set). In the Partition with Oversampling dialog, 50% was specified for both Specify % success in Training Set and Specify % Validation Set to be taken away as test data. As a result, Analytic Solver Data Science has randomly allocated 50% of the successes (the 1s) to the Training Set and the remaining 50% to the Validation Set (i.e., there are 288 successes in the Training Set, and 288 successes in the Validation Set). To complete the Training Set, Analytic Solver randomly selected 288 non successes (0s). The Training Set has 576 rows (288 1s + 288 0s).
The output above shows that the % Success in original data set is .9896. Analytic Solver maintains this percentage in the Validation Set by allocating as many 0s as needed. Since 288 successes (1s) have already been allocated to the Validation Set, 14,263 non successes (0s) must be added to the Validation Set to maintain the .98% ratio.
Since we specified 50% of Validation Set should be taken as test data, Analytic Solver Data Science has allocated 50% of the validation records to the test set. Each set contains 14,551 rows.